Hue Charts
One library for every chart.
See it
Every chart opens live.
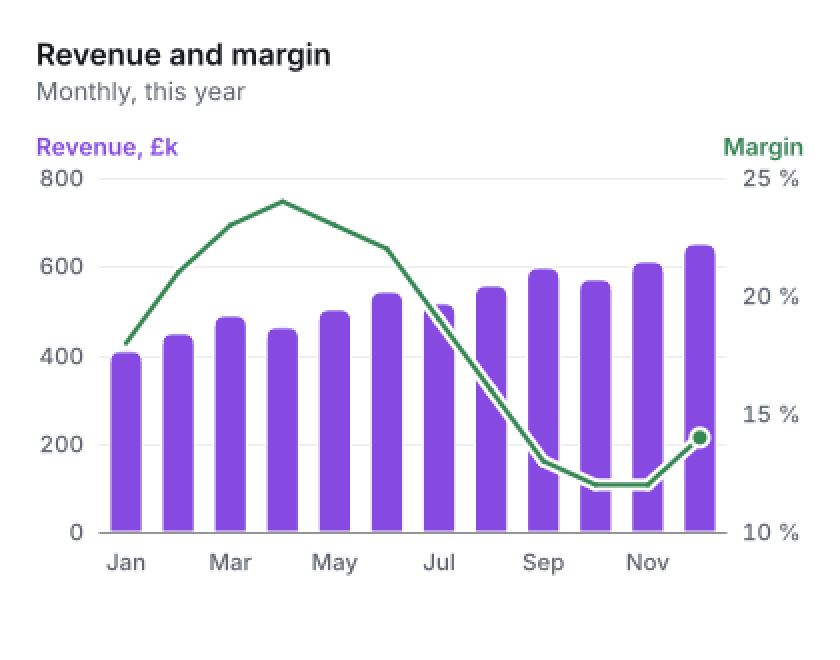
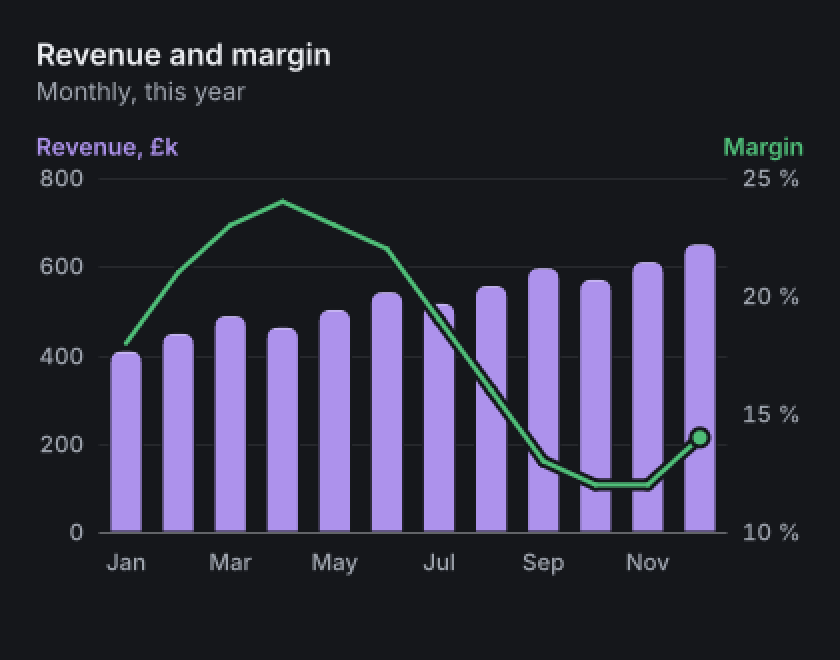
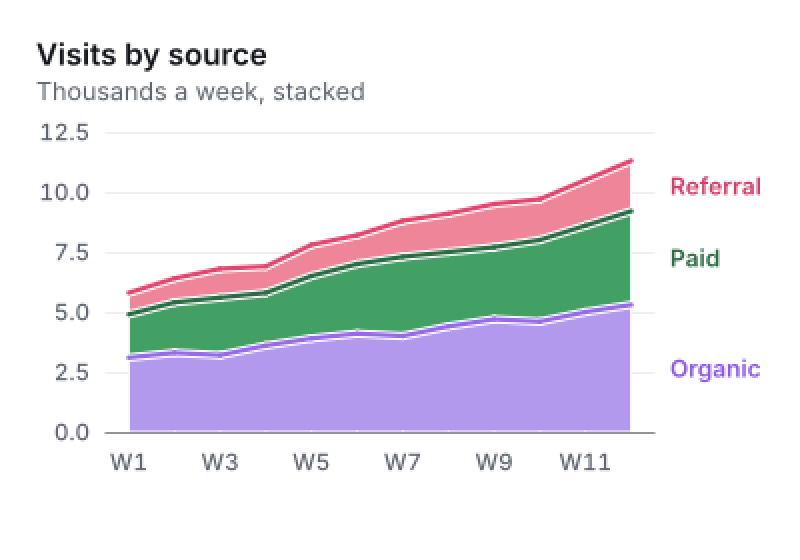
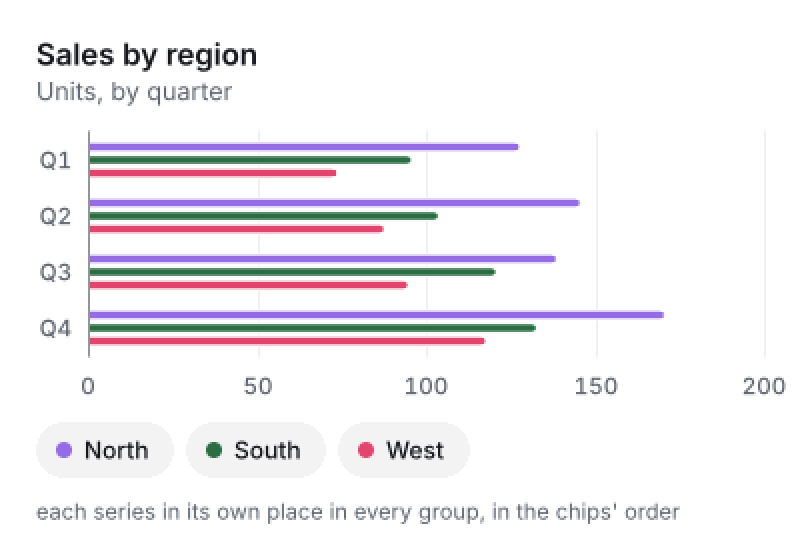
Colour: every series has 3:1 contrast with the background and stands apart from its neighbours, for every reader.
Your brand, kept readable
Your brand colour becomes series one, and every other series stays readable beside it.
Compare it
Every peak, zoomed on the GPU.
No peak lost
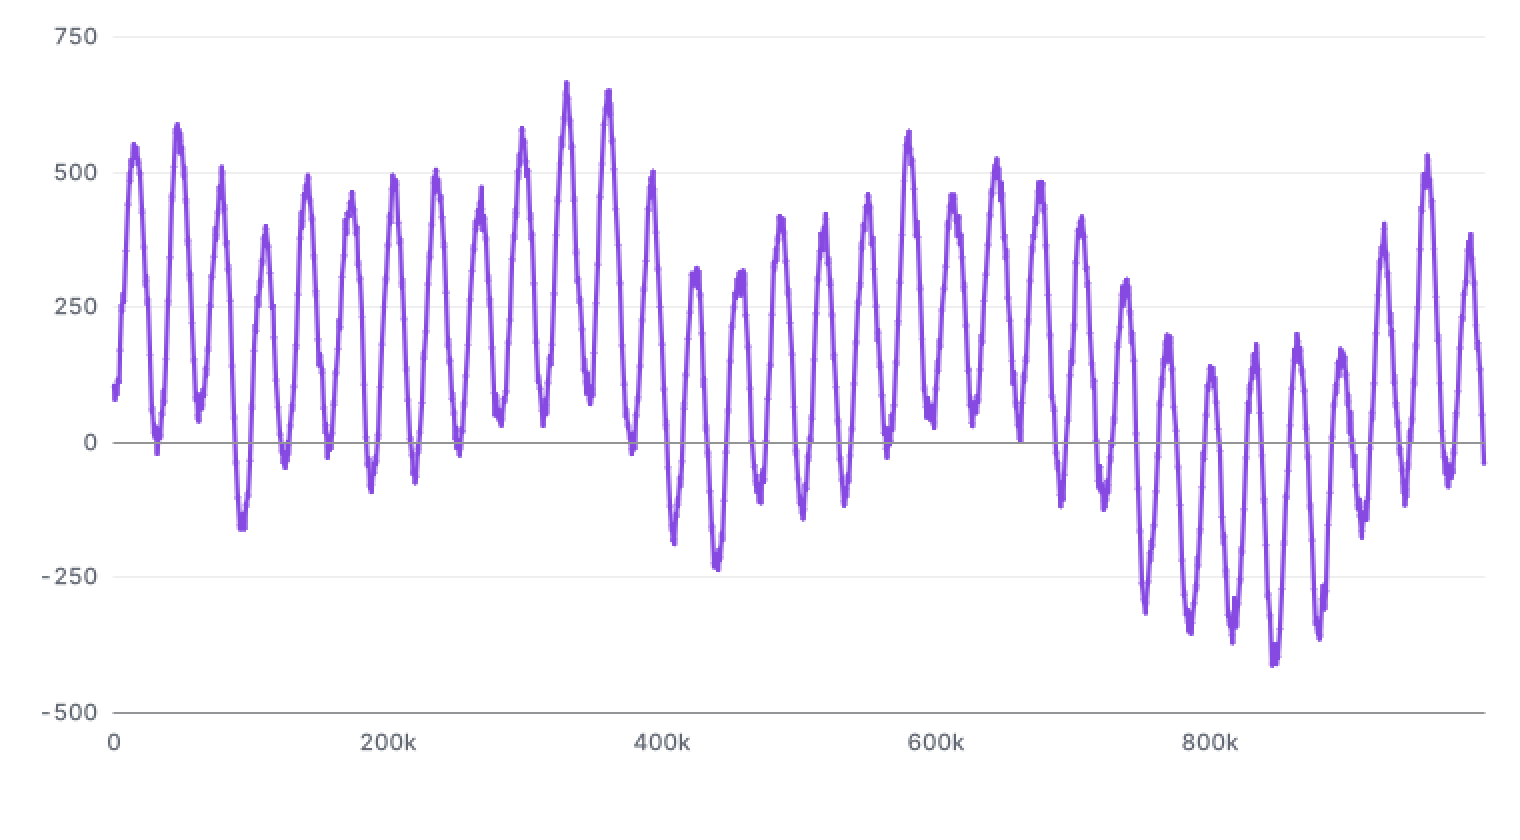
One spike among a billion samples is drawn in its place at every zoom, from the whole record down to a few hundred samples.
One spike in a billion samples by range, its extremes built first in 2.96 s, traced at twelve zooms to 238 samples in Node 24.8, Intel Core i7-14700K, 28 October 2026.
Zooms on the GPU
A million points zoom at 124 frames a second on the GPU, and ten million at 140, on a desktop at 154 Hz.
Fast mode on the GPU, a million and ten million points held and zoomed for three seconds in Edge 156 on an Intel Core i7-14700K with an RTX 4060 Ti, on a screen read at 154 Hz, 28 October 2026.
Big data, small memory
A billion-sample chart takes about 260 MB, and a live stream's million-point window stays at 16 MB, tested over ten million values.
The page's memory with a billion samples by range, in Edge 156 in Fast mode, Intel Core i7-14700K, 28 October 2026.
17 ms
to draw a million-point line first, then about 6 ms a frame as you zoom
760 × 420 on the CPU in Node 24.8, on an Intel Core i7-14700K desktop at normal priority, as a server runs, 28 October 2026: a first draw of new data, and a frame over the same data after it. The stream's window is fixed by its construction.
Trust it
Built for accessibility law.
The same chart everywhere
Within a major version, one spec gives the same digest on every engine the SLA covers.
Nothing else to install
No runtime dependencies, and every release lists every file it ships, for the Cyber Resilience Act.
Use it
Wherever your team already works.
Power BI
A visual that draws 29 charts and maps from your report's fields.
The web
One <hue-chart> element for plain HTML, Angular, Vue, Svelte or React.
The server
PNG, SVG and PDF from Node, Deno and Bun, the same bytes in each.
Assistants
Ask in plain words, and it draws the chart on your own machine.
- Phone and tablet
- Full screen
- Fluid width
- High-DPI
- Display P3
- Dark and light
- Reduced motion
- Right-to-left
- Locale and time zone
Start