Hue Draw

Connect once. Ask in plain words. Get a checked chart back.

Ask your assistant for a chart in plain words. It finds the right one, checks it and draws it on your own machine: nothing leaves it.
  • hue-charts-mcp: 8 tools
  • hue-maps-mcp: 2 tools
  • stdio, local
  • protocol 2025-06-18, 2025-03-26, 2024-11-05

Each server ships in its package and runs on your machine over stdio. It opens no network connection and never runs what an assistant writes.

Watch your assistant make one

How it works

Four requests, run for real.

Each one is run against the real server by the site's tests.
Step 1.

A retail analytics team

Connect it

Add it once to the assistant your team uses; it runs on your machine, so your rows, recipes and brand colour never leave it. The command fetches hue-charts from npm, where it is published at release; until then, put the path of the downloads' hue-charts-1.0.0.tgz in its place.

claude mcp add hue-charts -- npx -y -p hue-charts hue-charts-mcp
Step 2.

A finance team

Ask in plain words

No schema to read and no recipe to write — say what the chart should show, down to the colour it should be drawn in.

“Chart our Q3 revenue by region, drawn in our brand colour, #0a66c2.”

→ calls render_chart

Step 3.

A support operations team

Get a checked chart back

What comes back is checked: each series readable against the background, every series after the first patterned, and a digest to file it by.

“Chart our support tickets by priority for the exec review: 42 critical, 118 high, 206 medium, 340 low.”

→ calls render_chart

Step 4.

A data analyst, pasting someone else's file

Check before you ship

validate_recipe names each problem, and repair() mends what a rule can mend, checks it again and draws it. What it cannot safely guess, such as the series itself, it leaves for the analyst.

“Check this recipe against the schema and tell me what is wrong with it, then fix it.”

validate_recipe finds:

  • $.layers[0].mark: expected one of "bar", "line", "step", "area", "point", "rule", "text", "path", "segment"
  • $.layers[0].axis: expected one of "y", "y2"
  • $.layers[0]: colour is not part of the schema

repair() mends it:

  • layers[0].mark "column" is "bar"
  • layers[0].axis "left" is "y"
  • took out layers[0].colour

→ checked again, then drawn by render_chart

Step 5.

A board-pack editor

For print

A PDF with patterns on, so the chart still reads once it is printed in black and white. For a press, Chart Studio's PDF for print writes PDF/X-4 by your printer's own profile.

“Draw the column chart of orders by region for the board pack as a PDF, with patterns on so it reads when printed in black and white.”

→ calls render_chart

Connect it

Three lines, and it is there.

hue-charts-mcp, in the hue-charts package, draws the charts; hue-maps-mcp, in the hue-web-components package, draws maps, planes and the world.

Claude Code

claude mcp add hue-charts -- \
  npx -y -p hue-charts hue-charts-mcp

claude mcp add hue-maps -- \
  npx -y -p hue-web-components hue-maps-mcp

Claude Desktop

{
  "mcpServers": {
    "hue-charts": {
      "command": "npx",
      "args": ["-y", "-p",
        "hue-charts",
        "hue-charts-mcp"]
    },
    "hue-maps": {
      "command": "npx",
      "args": ["-y", "-p",
        "hue-web-components",
        "hue-maps-mcp"]
    }
  }
}

In claude_desktop_config.json, reached from Settings, Developer, Edit config.

Any MCP client

command: npx
args: -y -p hue-charts hue-charts-mcp

command: npx
args: -y -p hue-web-components hue-maps-mcp

Add each the way your client takes a stdio server's command and arguments.

Check it answers

One JSON-RPC line in, one line out: a tools/list call answers with the server's tools.

echo '{"jsonrpc":"2.0","id":1,"method":"tools/list"}' | npx -y -p hue-charts hue-charts-mcp
echo '{"jsonrpc":"2.0","id":1,"method":"tools/list"}' | npx -y -p hue-web-components hue-maps-mcp

Until Hue Charts is on npm, a free account downloads the package; the commands here run once it is published.

The protocol

JSON-RPC 2.0 over stdio, four methods

The protocol in full
  • Transport — stdio: one JSON-RPC 2.0 message a line in, one answer a line out. A line that is not JSON gets a parse error back; a server never writes anything but protocol to its output.
  • Methods — initialize, ping, tools/list and tools/call. Anything else answers the JSON-RPC error -32601 Method not found; an unknown tool name on tools/call answers -32602 Unknown tool.
  • Protocol versions — both servers speak 2025-06-18, 2025-03-26, 2024-11-05, newest first. On initialize, a server echoes back whichever of those the client asked for; asking for one it does not speak gets the newest it speaks, 2025-06-18, instead.
  • Initialize, hue-charts-mcp — the server names itself hue-charts and returns these instructions: “Hue Charts draws charts by a rule from your data. Find a chart with list_charts (a request in words works), read its spec with chart_schema, draw it with render_chart. For a chart of your own, suggest_recipe from rows or write a recipe against recipe_schema. The house recipes (combo, sparkline, recipe-stacked, recipe-lollipop, recipe-annotated, recipe-spread) are worked examples, from the simplest up: chart_schema gives each under examples. The hour ring draws when things happen round the day, from the times they happened or a value for each hour. A clock, a countdown or a stopwatch is a page's to show, by Hue Web Components' <hue-clock> or <hue-timer>, and no MCP draws one. The digest identifies the picture: the same spec, from the same package, gives the same digest anywhere. Every picture carries the Hue Charts credit in its foot: this is the free package; the paid package, for an organisation on a Business or Enterprise plan, draws none (huedraw.com/charts/pricing). No call can change it.”
  • Initialize, hue-maps-mcp — the server names itself hue-maps and returns these instructions: “Hue draws maps from the data you fetch. Read a view's data with map_schema, draw a view with render_map. The house recipes (recipe-floor, map-world) are worked examples: map_schema gives each under examples, and the recipe view draws your own recipe on a plane or the world. The data drawn must be yours to keep in a file: every output here is one. Every picture carries the Hue Charts credit in its foot: this is the free package; the paid package, for an organisation on a Business or Enterprise plan, draws none (huedraw.com/charts/pricing). No call can change it.”

The tools

Every tool, with its arguments

Read from each server. Open a tool for what it does, every argument, and an example call with what came back.

hue-charts-mcp, for the charts

list_charts

The charts Hue Charts draws, by the question each answers (each question with its charts: id, name, summary, and the chart a preset is of), then its own that answer no one question: the recipes and the kernel's own. With a request in words, the charts that fit it best, with the options the words asked for.

The arguments list_charts takes.
ArgumentTypeRequiredNotes
requeststringNooptional: what the chart should show, in words

An example call

{
  "request": "funnel of four stages"
}

What comes back

[
  {
    "id": "funnel",
    "name": "Funnel",
    "score": 5,
    "options": {}
  },
  {
    "id": "hypnogram",
    "name": "Hypnogram",
    "score": 2,
    "options": {}
  }
]

chart_schema

The JSON Schema of what one chart takes: its options with their kinds and bounds, and the shape of its data, plain named values where it reads them, and a table where it reads one (its rows' fields named).

The arguments chart_schema takes.
ArgumentTypeRequiredNotes
chartstringYes—

An example call

{
  "chart": "funnel"
}

What comes back

{
  "$schema": "https://json-schema.org/draft/2020-12/schema",
  "title": "Funnel (funnel)",
  "description": "stage by stage. Data: FunnelData — { stages: { label: string; value: number }[] }; observations?: { bonds?: number[] (each strictly between 0 and 1); carried?: string[]; landed?: string[] } (the one measure's)",
  "type": "object",
  "required": [
    "chart"
  ],
  "additionalProperties": false,
  "properties": {
    "chart": {
      "enum": [
        "funnel"
      ]
    },
    "options": {
      "type": "object",
      "additionalProperties": false,
      "properties": {
        "title": {
          "type": "string",
          "default": "",
          "description": "Title"
        },
        "context": {
          "type": "string",
          "default": "",
          "description": "Context: the unit and the period"
        },
        "figure": {
          "type": "string",
          "default": "",
          "description": "Headline figure, as written"
        },
        "conversion": {
          "type": "boolean",
          "default": true,
          "description": "Step conversion"
        },
        "values": {
          "type": "boolean",
          "default": true,
          "description": "Value labels"
        },
        "gap": {
          "type": "number",
          "minimum": 0,
          "maximum": 0.5,
          "default": 0.12,
          "description": "Gap between stages"
        }
      }
    },
    "data": {
      "oneOf": [
        {
          "type": "object",
          "description": "FunnelData — { stages: { label: string; value: number }[] }; observations?: { bonds?: number[] (each strictly between 0 and 1); carried?: string[]; landed?: string[] } (the one measure's)"
        },
        {
          "type": "object",
          "required": [
…

recipe_schema

The JSON Schema of a recipe: a chart as one file, your own chart as layers of marks over rows, on one or two axes, with annotations. Write one, keep it, change it, share it: every recipe is checked against this schema and drawn to WCAG 2.2 AA whatever it asks, so a file from anyone draws nothing malformed or unreadable.

Takes no arguments.

An example call

{}

What comes back

{
  "$schema": "https://json-schema.org/draft/2020-12/schema",
  "title": "Hue Charts recipe",
  "type": "object",
  "required": [
    "rows",
    "x",
    "layers"
  ],
  "additionalProperties": false,
  "properties": {
    "title": {
      "type": "string",
      "description": "The chart's title, drawn over it."
    },
    "rows": {
      "type": "array",
      "minItems": 1,
      "items": {
        "type": "object"
      },
      "description": "Your rows, one object to a row: the fields the layers name, each a string or a number."
    },
    "x": {
      "type": "object",
      "required": [
        "field"
      ],
      "additionalProperties": false,
      "description": "What runs across: the field each row is placed by, and how it is read.",
      "properties": {
        "field": {
          "type": "string",
          "description": "The field a row's place across is read from."
        },
        "type": {
          "enum": [
            "band",
            "linear",
            "time",
            "plane"
          ],
          "description": "band (names in the order they come; the default), linear (numbers), time (dates) or plane (x and y one scale, each row a place)."
        },
        "title": {
          "type": "string",
          "description": "The words under the axis across."
        }
      }
    },
    "y": {
      "type": "object",
      "additionalProperties": false,
      "description": "The value axis on the left.",
      "properties": {
        "title": {
          "type": "string",
          "description": "The words over the left axis."
        },
        "zero": {
          "type": "boolean",
          "description": "Start the left axis at naught: the default where the recipe has bars."
        },
        "unit": {
          "type": "s
…

validate_recipe

Check a recipe against its schema, one you wrote or one shared with you: valid, or every problem as a sentence and as data (its path, kind, what is allowed, what was found) to correct it by.

The arguments validate_recipe takes.
ArgumentTypeRequiredNotes
recipeobjectYes—

An example call

{
  "recipe": {
    "title": "Revenue by region",
    "rows": [
      {
        "month": "2026-01",
        "region": "North",
        "revenue": 62
      },
      {
        "month": "2026-01",
        "region": "South",
        "revenue": 48
      },
      {
        "month": "2026-02",
        "region": "North",
        "revenue": 74
      },
      {
        "month": "2026-02",
        "region": "South",
        "revenue": 55
      },
      {
        "month": "2026-03",
        "region": "North",
        "revenue": 58
      },
      {
        "month": "2026-03",
        "region": "South",
        "revenue": 61
      }
    ],
    "x": {
      "field": "month",
      "type": "time",
      "title": "Month"
    },
    "y": {
      "title": "Revenue",
      "zero": false
    },
    "layers": [
      {
        "mark": "line",
        "y": "revenue",
        "series": "region"
      }
    ]
  }
}

What comes back

{
  "valid": true
}

suggest_recipe

A recipe proposed from rows (JSON rows, or CSV text), by stated rules: x, series, marks and a second axis chosen from the fields' kinds and sizes; a file to keep, change and share.

The arguments suggest_recipe takes.
ArgumentTypeRequiredNotes
rowsarray of objectNo—
csvstringNo—
titlestringNo—

An example call

{
  "rows": [
    {
      "month": "2026-01",
      "region": "North",
      "revenue": 62
    },
    {
      "month": "2026-01",
      "region": "South",
      "revenue": 48
    },
    {
      "month": "2026-02",
      "region": "North",
      "revenue": 74
    },
    {
      "month": "2026-02",
      "region": "South",
      "revenue": 55
    },
    {
      "month": "2026-03",
      "region": "North",
      "revenue": 58
    },
    {
      "month": "2026-03",
      "region": "South",
      "revenue": 61
    }
  ],
  "title": "Revenue by region"
}

What comes back

{
  "title": "Revenue by region",
  "rows": [
    {
      "month": "2026-01",
      "region": "North",
      "revenue": 62
    },
    {
      "month": "2026-01",
      "region": "South",
      "revenue": 48
    },
    {
      "month": "2026-02",
      "region": "North",
      "revenue": 74
    },
    {
      "month": "2026-02",
      "region": "South",
      "revenue": 55
    },
    {
      "month": "2026-03",
      "region": "North",
      "revenue": 58
    },
    {
      "month": "2026-03",
      "region": "South",
      "revenue": 61
    }
  ],
  "x": {
    "field": "month",
    "type": "time",
    "title": "Month"
  },
  "y": {
    "title": "Revenue",
    "zero": false
  },
  "layers": [
    {
      "mark": "line",
      "y": "revenue",
      "series": "region"
    }
  ]
}

render_chart

Draw a Hue Charts chart, of its catalogue or its own beyond it (list_charts names them), or a recipe (chart "recipe" with the recipe as data), and return it as a PNG lettered by the kernel, an SVG, a PDF or its data table as CSV, with its digest: the same chart, from the same package, gives the same digest on every machine. Beside options: format (png, svg, pdf or csv; png when left out), readout (oklch, p3 or hsl), palette (okabe-ito, viridis or cividis), shape (crisp or rounded), mode (a dark or light ground), brand (a #hex colour for series one), locale and timeZone, width and height (760 × 420 when left out). Every chart is drawn to WCAG 2.2 AA whatever is asked: every series at 3:1 against the ground and solved apart for every kind of vision, the ground between series where they touch, and each series after the first hatched, dashed or shaped as well as coloured; a colour asked that would sink into the ground is drawn at its nearest lightness that does not, and said in moved. A picture that draws observation keeps its observed lightness: its series are named by dash and marker shape, and a mark below 3:1 carries its value in text, said in faint. Data may be the chart's own shape, plain named values, or a table of rows, one to each key, as a spreadsheet or a report holds it (chart_schema names each chart's fields).

The arguments render_chart takes.
ArgumentTypeRequiredNotes
chartstringYes—
optionsobjectNo—
dataanyNothe chart's own data (chart_schema gives its shape), or plain named values: { named: [{ label, value, series? }] }, or a table: { table: [{ category, value, series?, … }], unit?, order? }, the fields each chart reads named in chart_schema
modeone of dark, lightNo—
formatone of png, svg, pdf, csvNo—
readoutone of oklch, p3, hslNothe read-out: OKLCH, OKLCH in Display P3 for wide-gamut screens, or HSL
shapeone of crisp, roundedNohow the marks are shaped: rounded (the default: bar ends, tiles and cells rounded) or crisp (as laid); a line keeps its chart's own path (curve) in either
paletteone of okabe-ito, viridis, cividisNo—
widthinteger, 64 to 4096No—
heightinteger, 64 to 4096No—
localestringNo—
timeZonestringNo—
brandstringNo#hex: series one drawn nearest this colour; not drawn under a palette, said in notDrawn

An example call

{
  "chart": "column",
  "data": {
    "named": [
      {
        "label": "North",
        "value": 412
      },
      {
        "label": "South",
        "value": 365
      },
      {
        "label": "East",
        "value": 298
      },
      {
        "label": "West",
        "value": 331
      }
    ]
  }
}

What comes back

{
  "chart": "column",
  "title": "Column",
  "digest": "42376f96",
  "width": 760,
  "height": 420,
  "points": 4,
  "labels": 10
}
an image (image/png), 14,034 bytes

candle_tick

Trades folded into candlestick data as a live chart takes them, in the order given: inside the forming bar's interval its high, low, close and volume move and its open holds; past it a new bar opens at the trade's price, on the interval's boundary counted from origin (milliseconds since 1970 UTC; 1970 itself when left out, a Thursday, so give a Monday's origin for weeks from Monday). A trade before the last one taken is late and counted in the reply: inside the forming bar it is folded into its high, low and volume, and its open where it is the earliest, never its close; before it, it changes nothing. Candles as candlestick takes them, with lastTrade and openedAt as the last reply gave them (empty to begin); dates in UTC, YYYY-MM-DD or with THH:MM, THH:MM:SS or THH:MM:SS.sss, the last a bar of the interval. Each trade { t: milliseconds since 1970 UTC, price, size of naught or more }; the interval in milliseconds (60000 a minute, 86400000 a day). Returns the candles, to draw with render_chart as candlestick, and how many trades were taken and late.

The arguments candle_tick takes.
ArgumentTypeRequiredNotes
candlesobject: { dates, candles, lastTrade, openedAt }No—
tradesarray of { t, price, size }Yes—
intervalnumber, above 0Yes—
originnumberNo—

An example call

{
  "trades": [
    {
      "t": 0,
      "price": 100,
      "size": 10
    },
    {
      "t": 15000,
      "price": 102,
      "size": 5
    },
    {
      "t": 45000,
      "price": 99,
      "size": 8
    },
    {
      "t": 61000,
      "price": 103,
      "size": 6
    },
    {
      "t": 90000,
      "price": 105,
      "size": 4
    },
    {
      "t": 125000,
      "price": 101,
      "size": 7
    }
  ],
  "interval": 60000
}

What comes back

{
  "dates": [
    "1970-01-01T00:00",
    "1970-01-01T00:01",
    "1970-01-01T00:02"
  ],
  "candles": [
    {
      "o": 100,
      "h": 102,
      "l": 99,
      "c": 99,
      "v": 23
    },
    {
      "o": 103,
      "h": 105,
      "l": 103,
      "c": 105,
      "v": 10
    },
    {
      "o": 101,
      "h": 101,
      "l": 101,
      "c": 101,
      "v": 7
    }
  ],
  "lastTrade": 125000,
  "openedAt": 125000
}
6 trades taken in time order, 0 late: 0 of them folded into the forming bar (its high, low and volume, and its open where one is the earliest), never its close, 0 before the forming bar, changing nothing
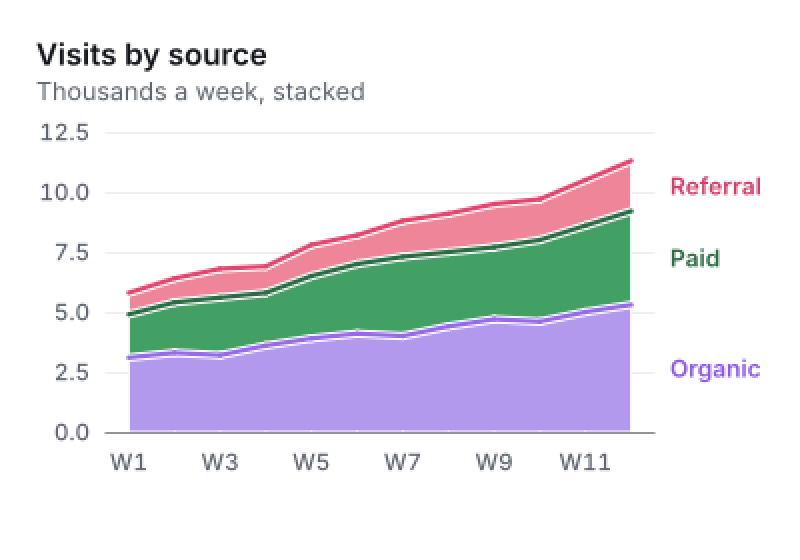
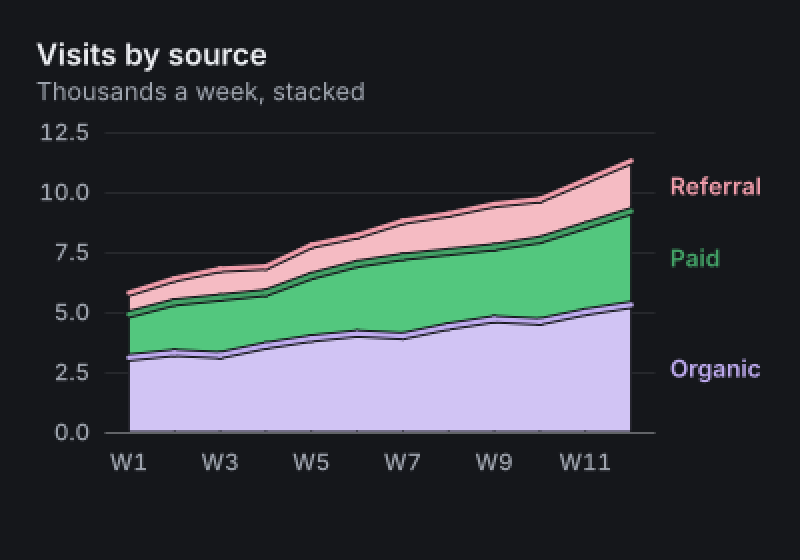
check_theme

The accessibility report of a theme for n series: contrast against the ground and separation under simulated colour-vision deficiencies, for the theme as given and as drawn (made compliant, with what was moved to make it so), with the drawn theme's CSS design tokens. A brand colour sets series one.

The arguments check_theme takes.
ArgumentTypeRequiredNotes
seriesinteger, 1 to 24Yes—
modeone of dark, lightNo—
brandstringNo—

An example call

{
  "series": 5,
  "brand": "#0a66c2"
}

What comes back

{
  "asGiven": {
    "contrast": [
      {
        "series": 0,
        "ratio": 3.1552210101235003,
        "ok": true
      },
      {
        "series": 1,
        "ratio": 3.401468731766879,
        "ok": true
      },
      {
        "series": 2,
        "ratio": 2.7519555835515543,
        "ok": false
      },
      {
        "series": 3,
        "ratio": 3.218150424498167,
        "ok": true
      },
      {
        "series": 4,
        "ratio": 2.847681407717616,
        "ok": false
      }
    ],
    "separation": [
      {
        "vision": "normal",
        "a": 1,
        "b": 3,
        "distance": 0.10548423473567244,
        "ok": true
      },
      {
        "vision": "protan",
        "a": 1,
        "b": 3,
        "distance": 0.04966005154529379,
        "ok": false
      },
      {
        "vision": "deutan",
        "a": 0,
        "b": 2,
        "distance": 0.03258273119647917,
        "ok": false
      },
      {
        "vision": "tritan",
        "a": 0,
        "b": 1,
        "distance": 0.045063189928847856,
        "ok": false
      }
    ],
    "ok": false
  },
  "drawn": {
    "contrast": [
      {
        "series": 0,
        "ratio": 3.455982289788269,
        "ok": true
      },
      {
        "series": 1,
        "ratio": 3.734420737453,
        "ok": true
      },
      {
        "series": 2,
        "ratio": 3.000000002048585,
        "ok": true
      },
      {
        "series": 3,
        "ratio": 3.527138149890545,
        "ok": true
      },
      {
        "series": 4,
        "ratio": 3.108239581728916,
        "ok": true
      }
    ],
    "separation": [
      {
        "vision": "normal",
        "a": 1,
        "b": 3,
        "distance": 0.1098938066333167,
        "ok": true
      },
      {
        "vision": "protan",

…

hue-maps-mcp, for maps, planes and the world

map_schema

The JSON Schema of what one map view takes (choropleth, flow-map, recipe-floor, map-world, recipe): regions by their codes or names, flows between places, places by longitude and latitude. A choropleth's regions are the world's countries (ISO 3166-1), its UN M49 regions, every country's regions (ISO 3166-2, the country named by the option country or by the codes), the US states or the UK's ITL1 regions; every country's regions are registered here. The data drawn must be yours to keep in a file: every output here is one.

The arguments map_schema takes.
ArgumentTypeRequiredNotes
viewone of choropleth, flow-map, recipe-floor, map-world, recipeYesthe map view

An example call

{
  "view": "choropleth"
}

What comes back

{
  "$schema": "https://json-schema.org/draft/2020-12/schema",
  "title": "Choropleth (choropleth)",
  "description": "value by region. Data: ChoroplethData — { values: Record<regionId, number>; label: string; unit?: string; unitOne?: string (its singular, after a value of one); regions?: { id; name; rings: number[][] }[] }",
  "type": "object",
  "required": [
    "chart"
  ],
  "additionalProperties": false,
  "properties": {
    "chart": {
      "enum": [
        "choropleth"
      ]
    },
    "options": {
      "type": "object",
      "additionalProperties": false,
      "properties": {
        "title": {
          "type": "string",
          "default": "",
          "description": "Title"
        },
        "context": {
          "type": "string",
          "default": "",
          "description": "Context: the unit and the period"
        },
        "figure": {
          "type": "string",
          "default": "",
          "description": "Headline figure, as written"
        },
        "regions": {
          "enum": [
            "countries",
            "world regions",
            "country regions",
            "US states",
            "UK regions"
          ],
          "default": "countries",
          "description": "Regions"
        },
        "country": {
          "type": "string",
          "default": "",
          "description": "Country"
        },
        "projection": {
          "enum": [
            "equal-earth",
            "equirectangular",
            "mercator"
          ],
          "default": "equal-earth",
          "description": "Projection"
        },
        "graticule": {
          "type": "boolean",
          "default": true,
          "description": "Graticule"
        },
        "scale": {
          "enum": [
            "quantile",
…

render_map

Draw a map view and return it as a PNG lettered by the kernel, an SVG, a PDF or its data table as CSV, with its digest: the same map, from the same package, gives the same digest on every machine; a region set's source in one Data line. Beside options: format (png, svg, pdf or csv; png when left out), mode (a dark or light ground), width and height (760 × 420 when left out), locale and timeZone. The data drawn must be yours to keep in a file: every output here is one.

The arguments render_map takes.
ArgumentTypeRequiredNotes
viewone of choropleth, flow-map, recipe-floor, map-world, recipeYesthe map view
dataanyNothe view's data, as map_schema gives it
optionsobjectNo—
formatone of png, svg, pdf, csvNo—
modeone of dark, lightNo—
widthinteger, 64 to 4096No—
heightinteger, 64 to 4096No—
localestringNo—
timeZonestringNo—

An example call

{
  "view": "recipe",
  "data": {
    "title": "Two desks and a door",
    "rows": [
      {
        "name": "Door",
        "x": 0,
        "y": 0
      },
      {
        "name": "Desk A",
        "x": 4,
        "y": 3
      },
      {
        "name": "Desk B",
        "x": 8,
        "y": 1
      }
    ],
    "x": {
      "field": "x",
      "type": "plane"
    },
    "layers": [
      {
        "mark": "point",
        "y": "y",
        "text": "name"
      }
    ]
  }
}

What comes back

{
  "view": "recipe",
  "title": "Two desks and a door",
  "digest": "c8667025",
  "width": 760,
  "height": 420,
  "points": 3,
  "labels": 1
}
an image (image/png), 8,775 bytes

What comes back

A picture, its digest, and what was moved

A tool's result carries one or more pieces of content, each typed text, image or resource. render_chart answers first with a text piece of metadata: the chart's slug, its title, its digest, its width and height, and, where they apply, moved (colours moved to stay readable), faint (marks too faint to read, their values written as text) and notDrawn (what was asked for and not drawn). render_map's metadata names the view, its title and digest, its width and height, how many points and labels it drew, the region set's credit and what was moved. Then the picture: a PNG as an image piece, an SVG or a CSV data table as a further text piece, or a PDF as a resource piece.

The digest is eight hex characters, FNV-1a over the picture's bytes. Within a major version, one spec gives the same digest on every engine the SLA covers.

The credit

Every everyday chart is free to use, and the charts of science come with a Business or Enterprise plan: the server in a free package lists them and draws none. The server in a free package draws the words “Hue Charts” in the foot of every picture, and nothing switches it off; the server in a paid package, which an organisation on a Business or Enterprise plan downloads, draws none. No call or setting changes it, so the same chart from the same package gives the same digest. Started from the free packages, as the commands above start it, a server draws the credit.

Help

Where to get help

  • Support for the server is covered by the service level agreement: its definition of the Software names the hue-charts-mcp server by name.
  • Security reports go through the same channel as the rest of the package: Report a vulnerability privately, by email to support@chromaticcoherence.ai with "Security" in the subject. Never report one in public.
  • Everything else about Hue Charts: support.