Hue Draw

Hue, the design system.

One look on every chart: the same card, the same type and one colour law. Every chart here is drawn by Hue Charts.

Every chart

Every chart in one language.

All 61 charts in the catalogue, from a headline number to a stopwatch, each drawn by the library from its own sample with its card's words.
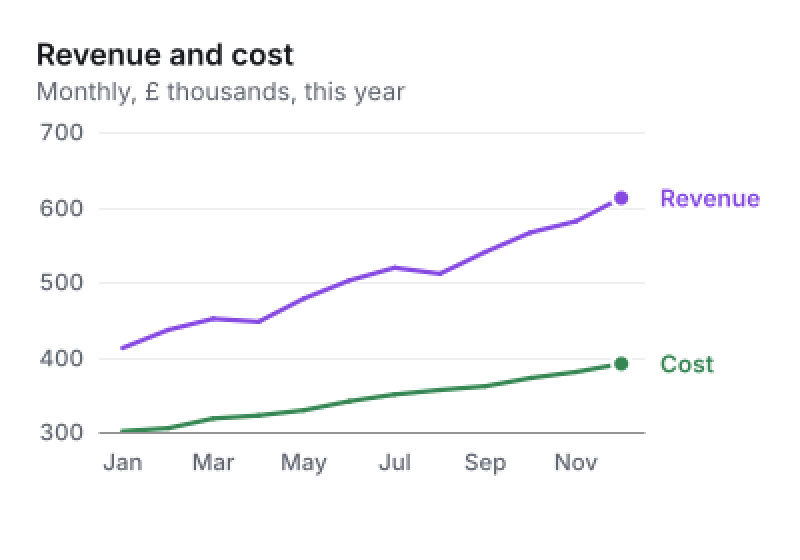
Revenue and cost: the line chart, drawn by Hue Charts from its own sample.
Line
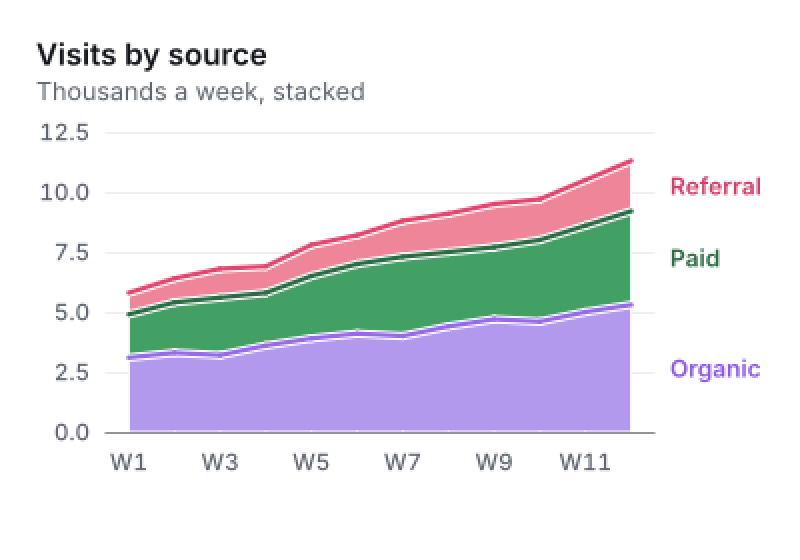
Visits by source: the area chart, drawn by Hue Charts from its own sample.
Area
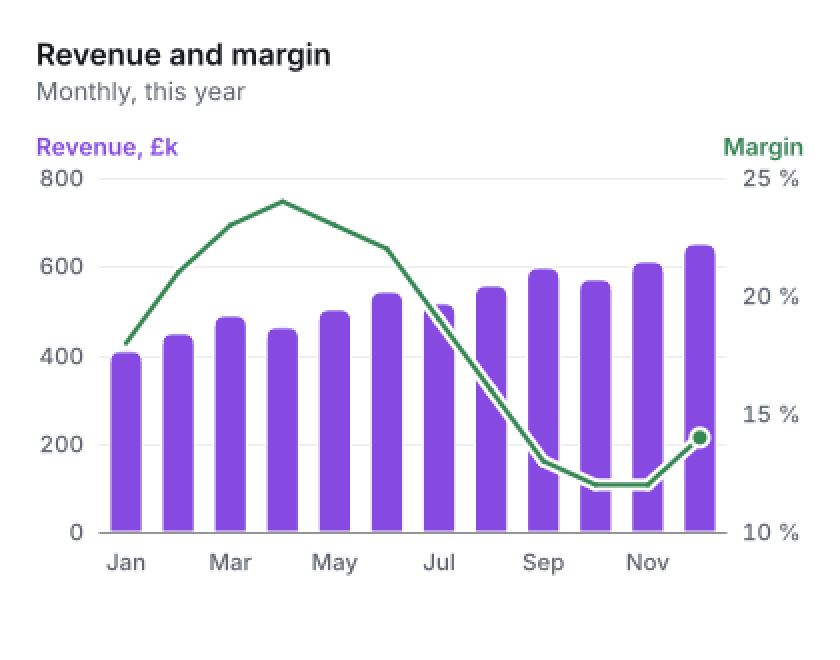
Revenue and margin: the combo chart, drawn by Hue Charts from its own sample.
Combo
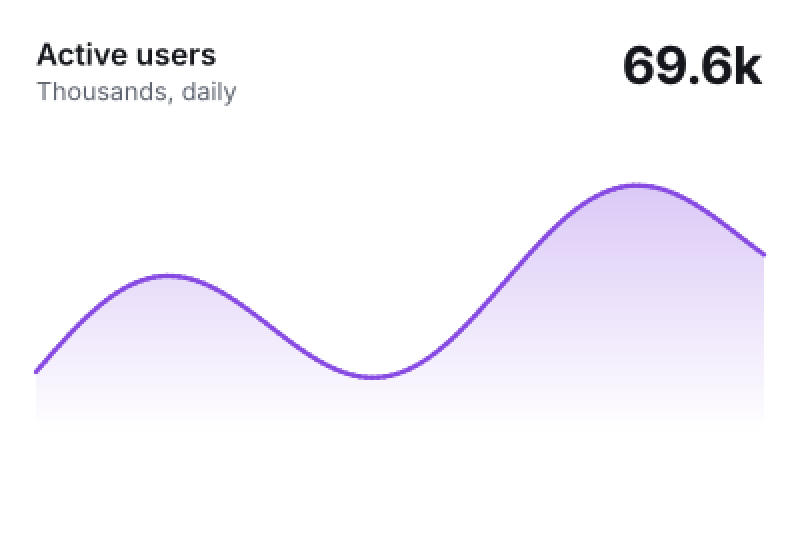
Active users: the sparkline chart, drawn by Hue Charts from its own sample.
Sparkline
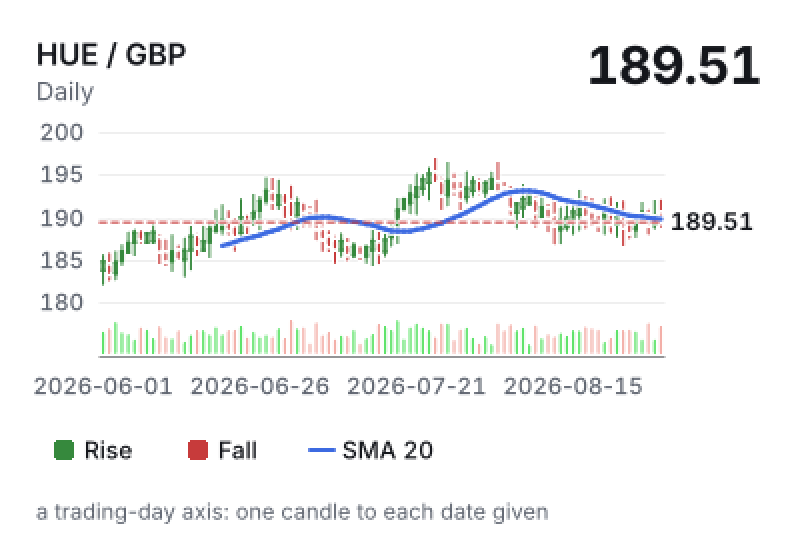
HUE / GBP: the candlestick chart, drawn by Hue Charts from its own sample.
Candlestick
A trading day in two seconds
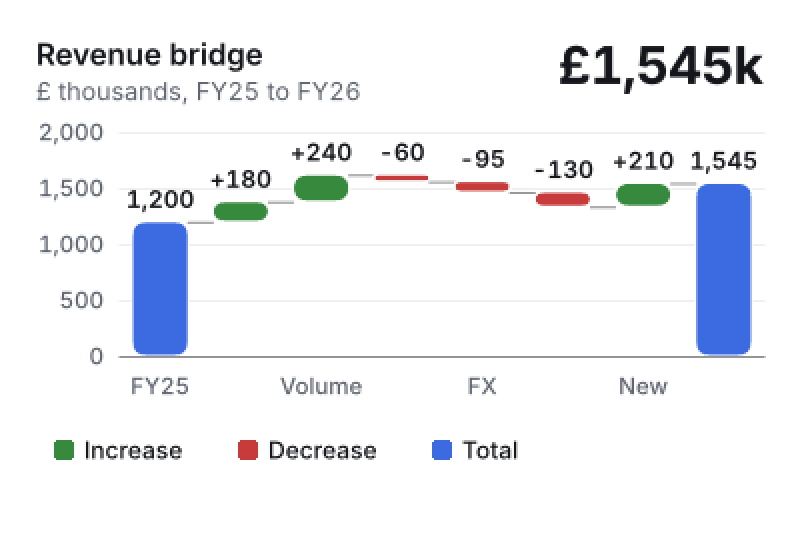
Revenue bridge: the waterfall chart, drawn by Hue Charts from its own sample.
Waterfall
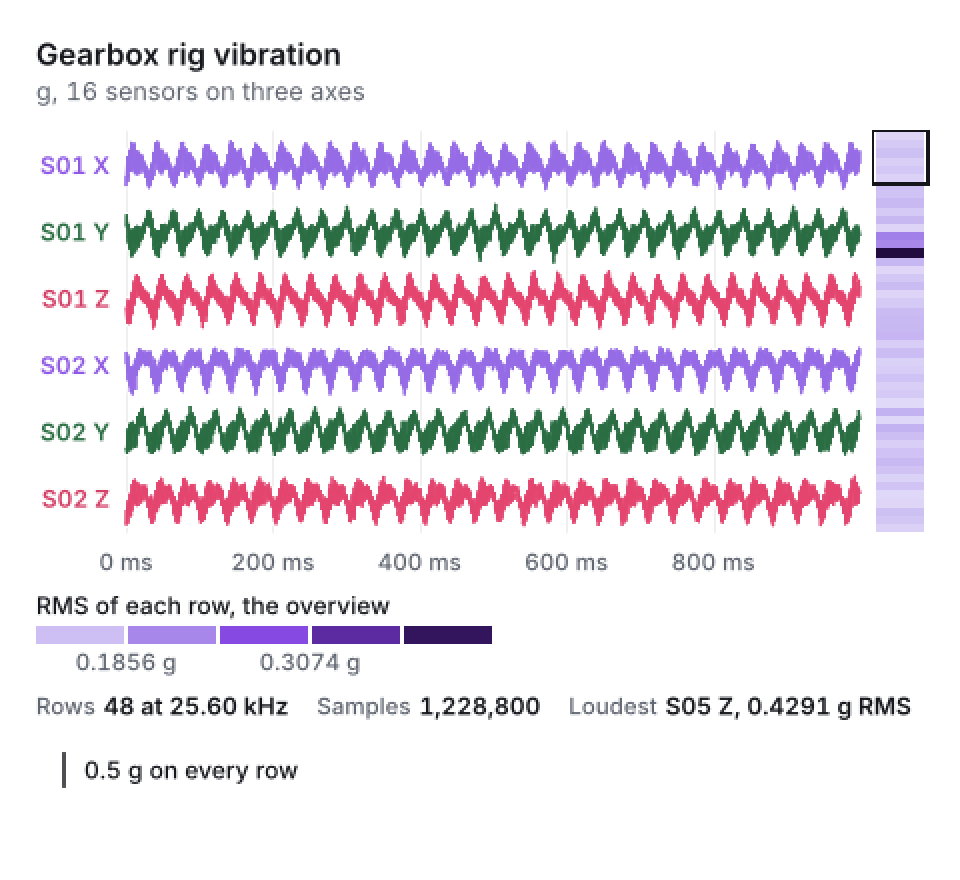
Gearbox rig vibration: the strip chart, drawn by Hue Charts from its own sample.
Strip chart
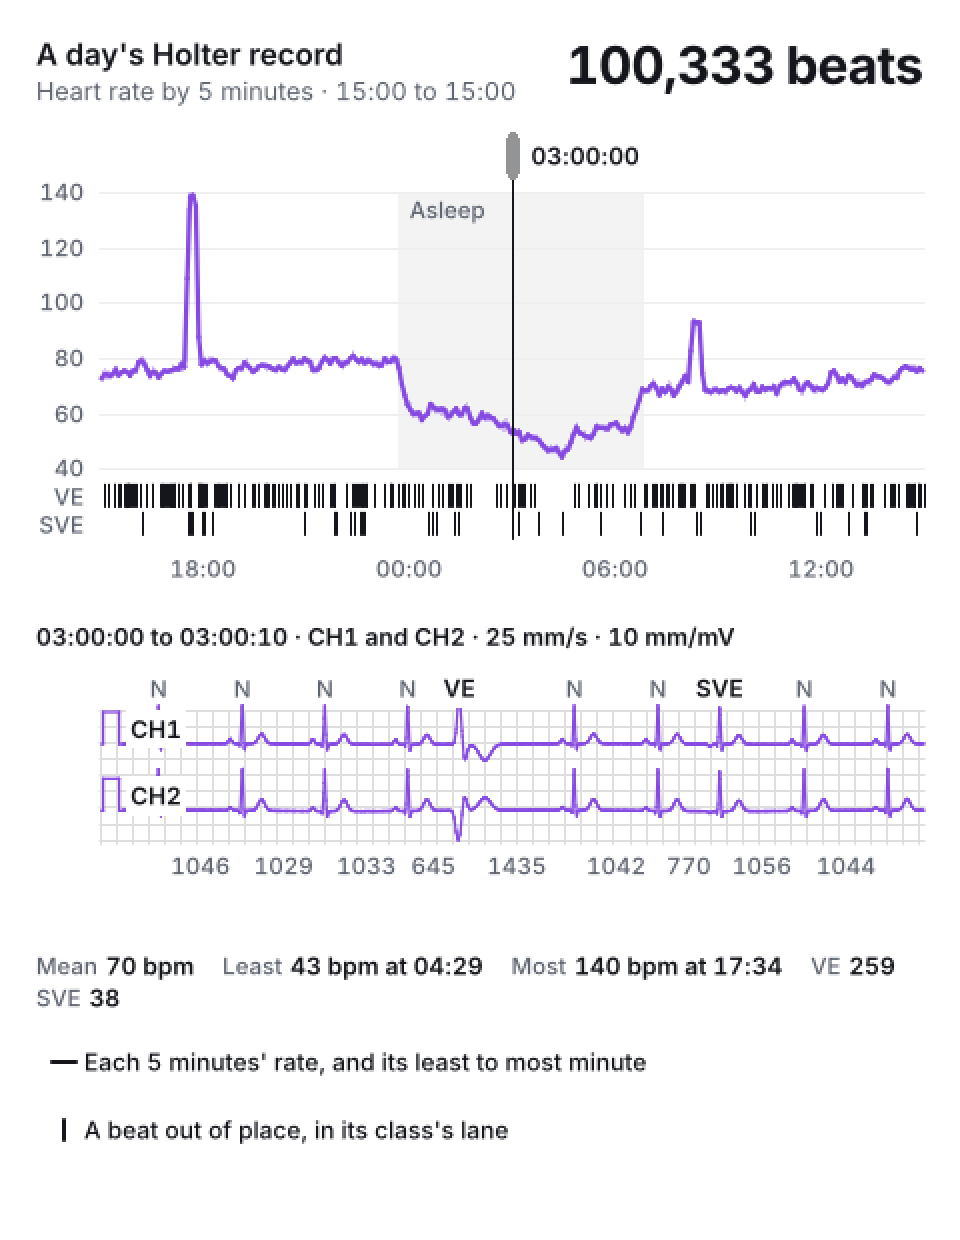
A day's Holter record: the Holter chart, drawn by Hue Charts from its own sample.
Holter
A day in a minute
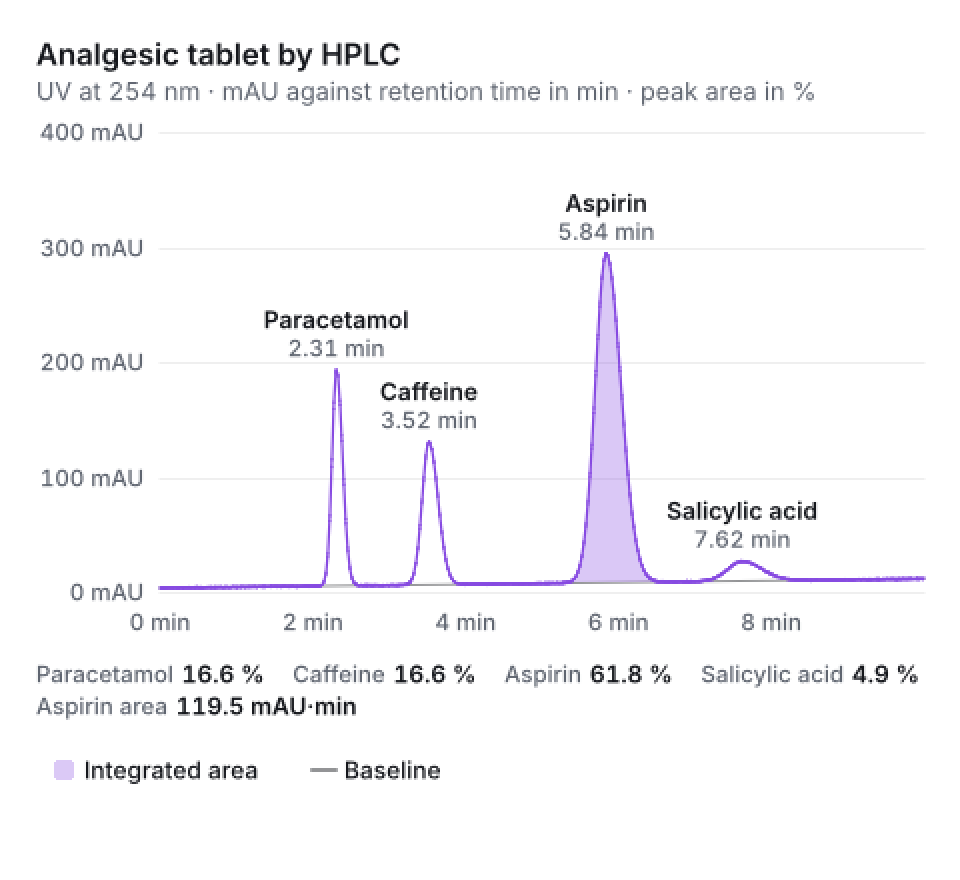
Analgesic tablet by HPLC: the chromatogram chart, drawn by Hue Charts from its own sample.
Chromatogram
A ten-minute run in ten seconds
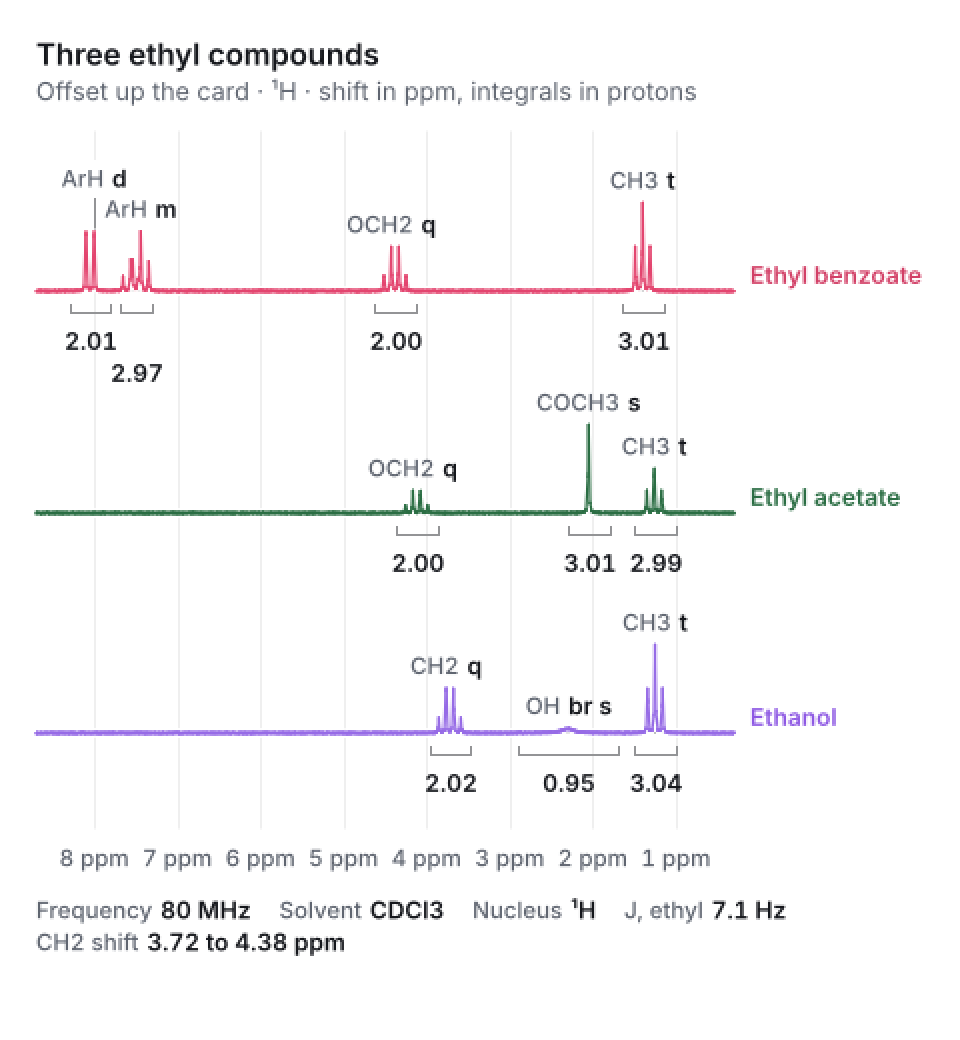
Three ethyl compounds: the stacked NMR chart, drawn by Hue Charts from its own sample.
Stacked NMR
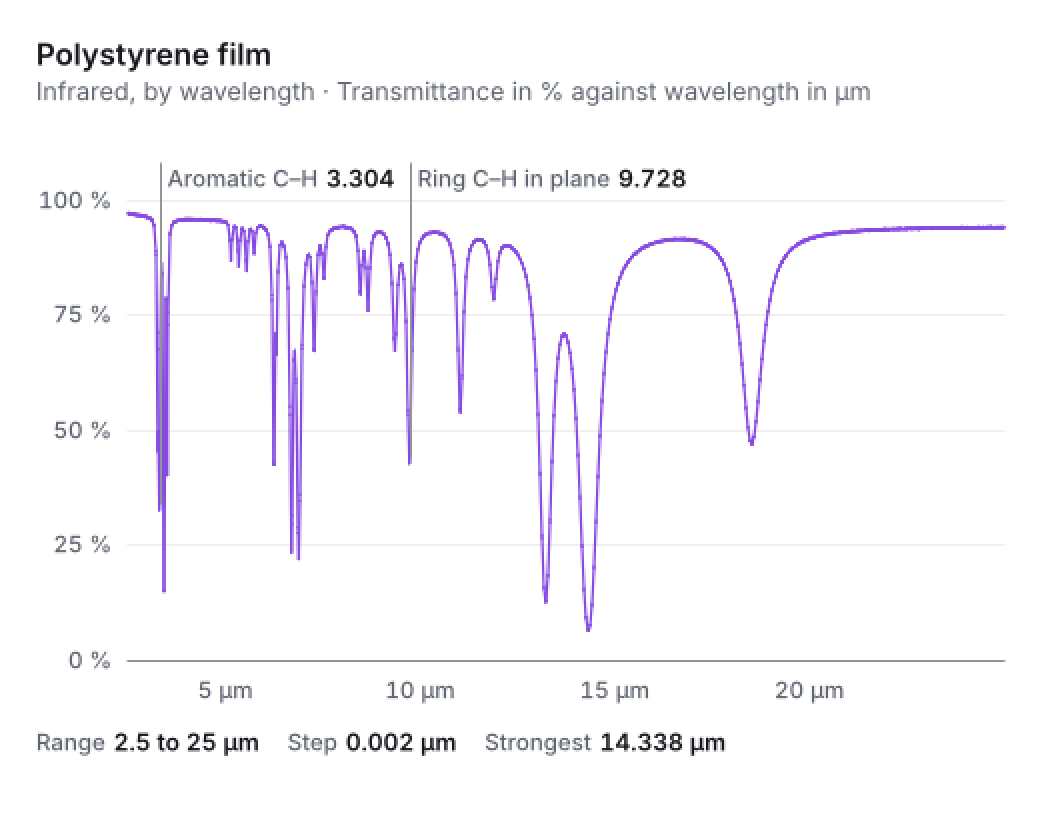
Polystyrene film: the spectrum chart, drawn by Hue Charts from its own sample.
Spectrum
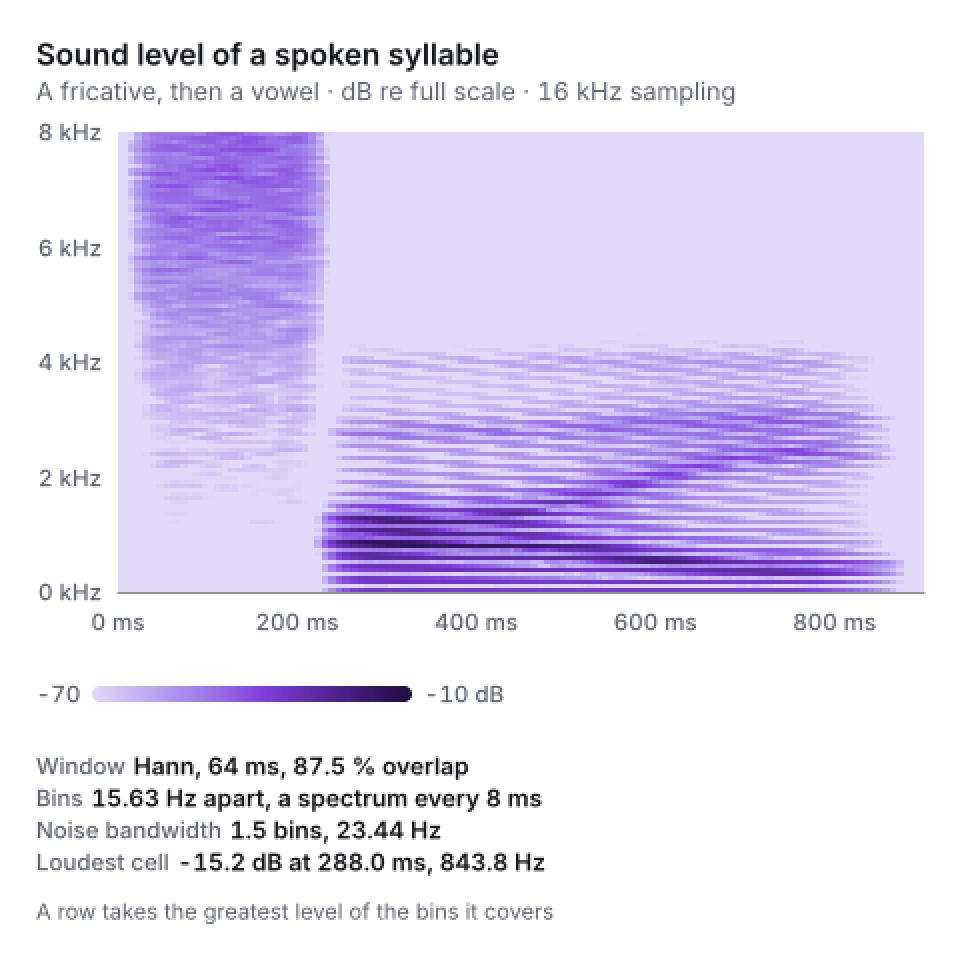
Sound level of a spoken syllable: the spectrogram chart, drawn by Hue Charts from its own sample.
Spectrogram
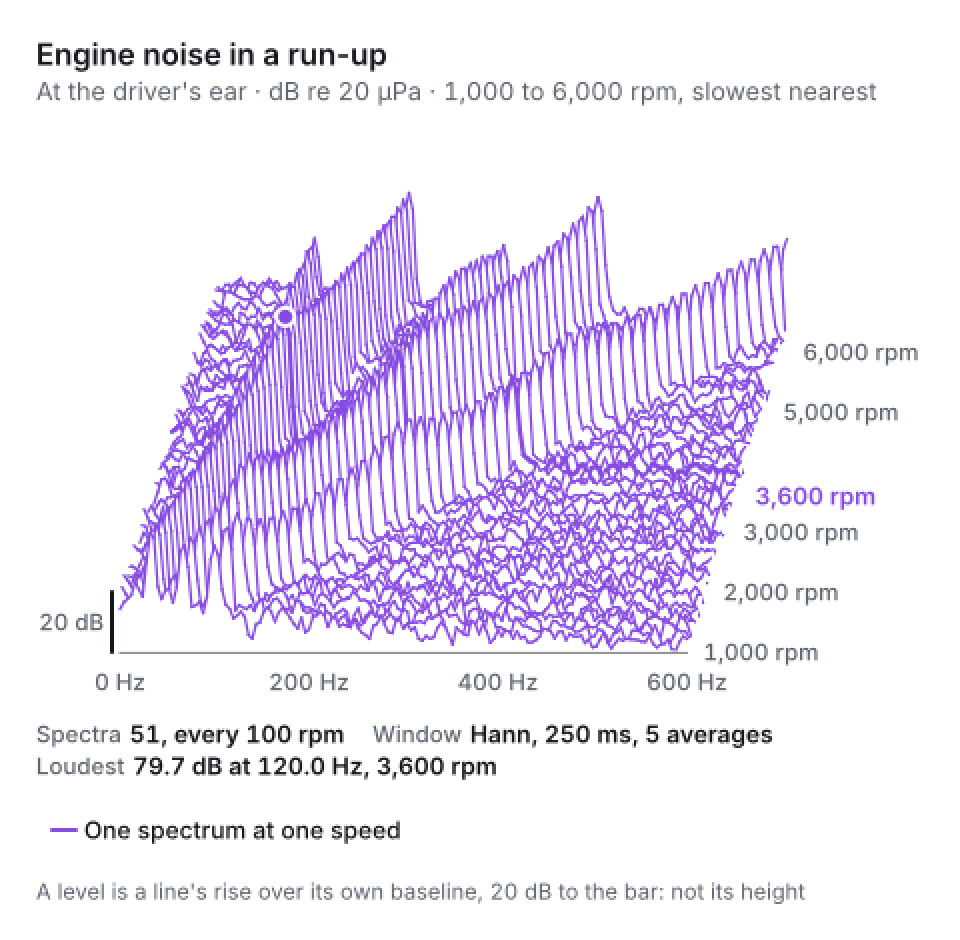
Engine noise in a run-up: the spectrum waterfall chart, drawn by Hue Charts from its own sample.
Spectrum waterfall
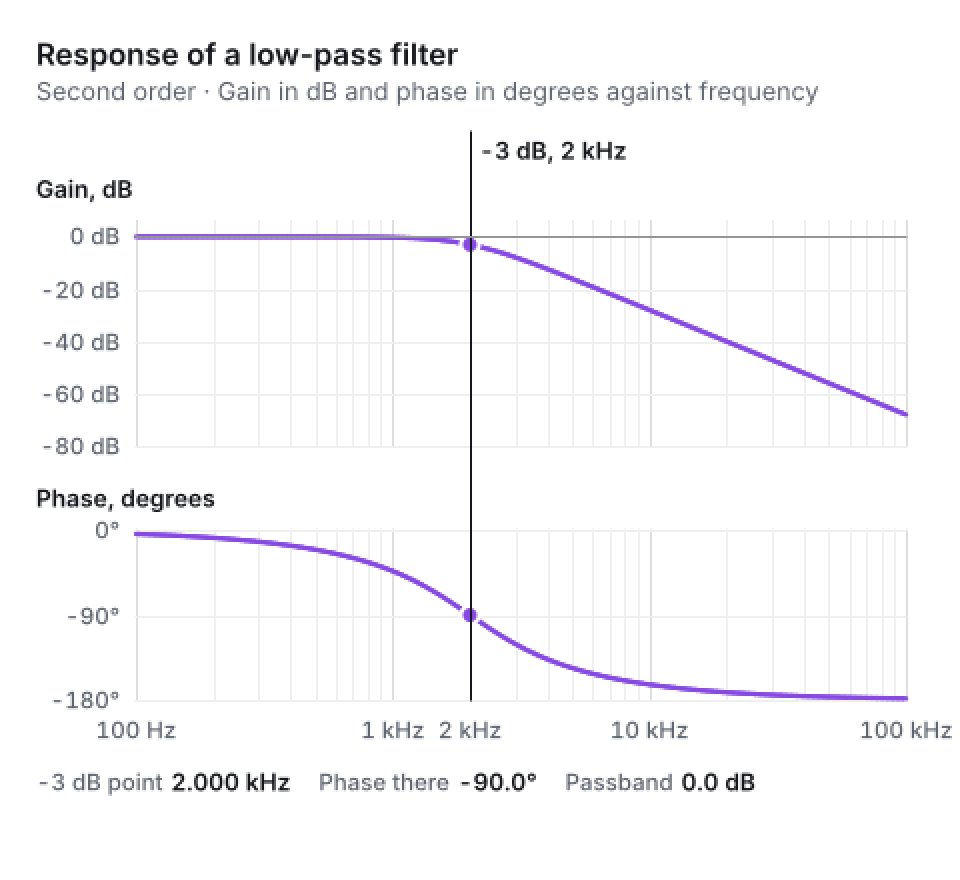
Response of a low-pass filter: the Bode plot chart, drawn by Hue Charts from its own sample.
Bode plot
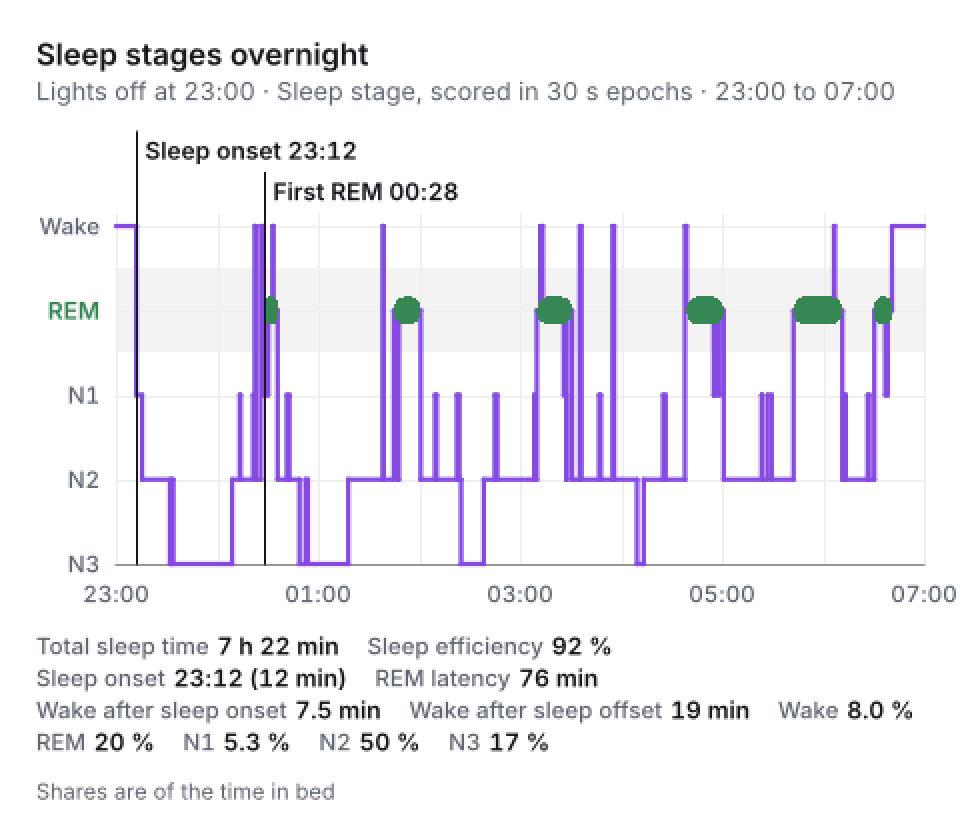
Sleep stages overnight: the hypnogram chart, drawn by Hue Charts from its own sample.
Hypnogram
A night in a minute
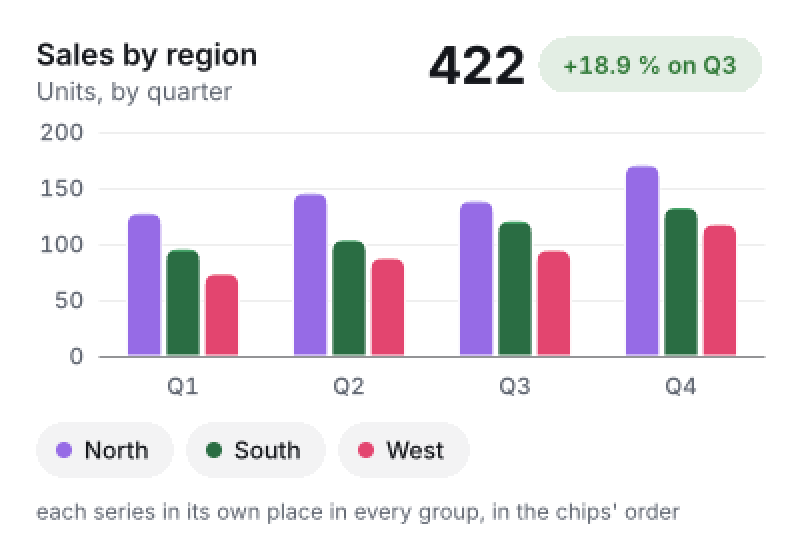
Sales by region: the column chart, drawn by Hue Charts from its own sample.
Column
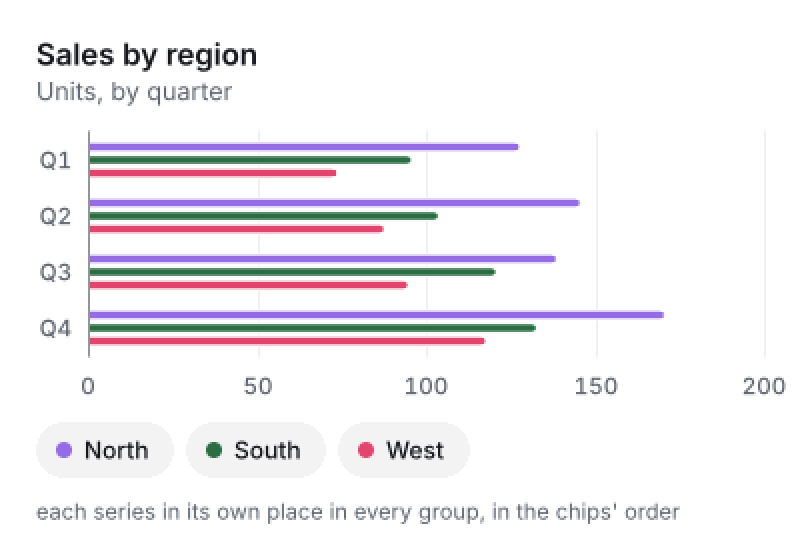
Sales by region: the bar chart, drawn by Hue Charts from its own sample.
Bar
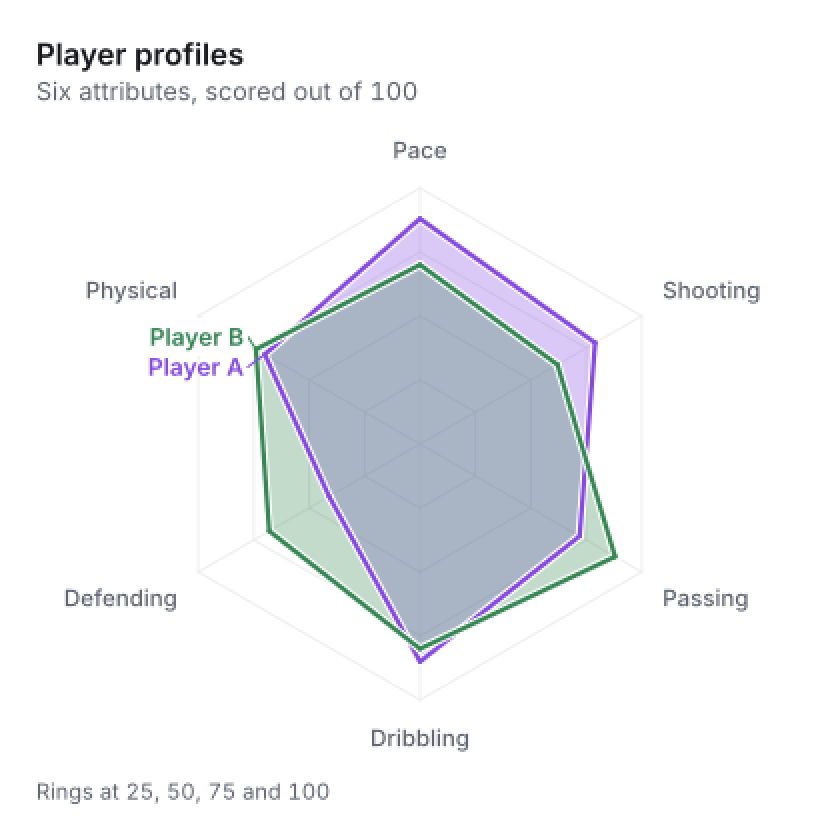
Player profiles: the radar chart, drawn by Hue Charts from its own sample.
Radar
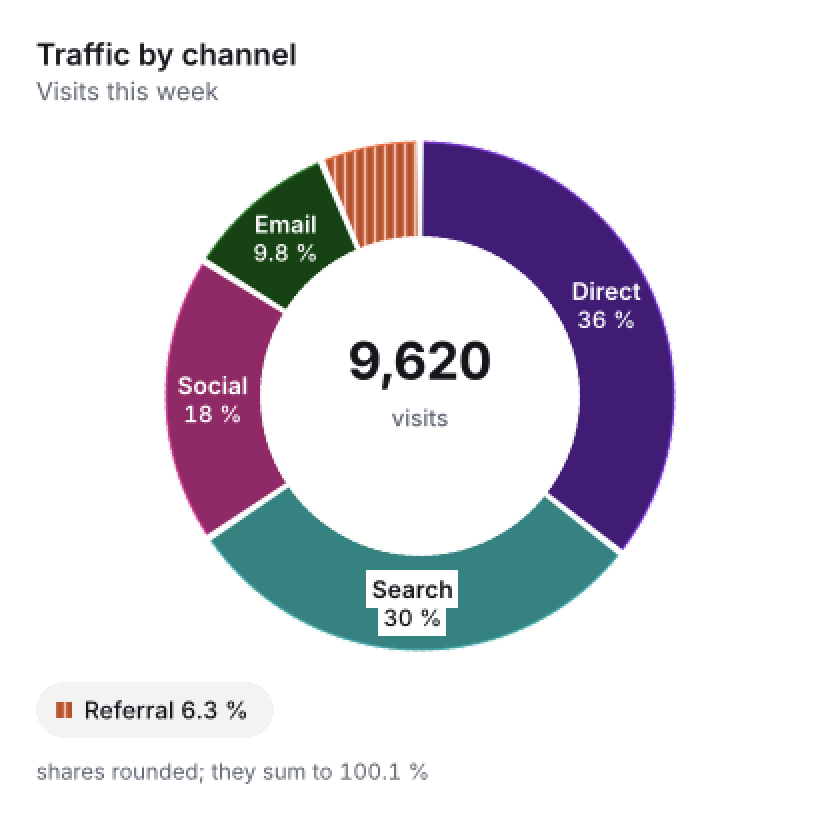
Traffic by channel: the donut chart, drawn by Hue Charts from its own sample.
Donut
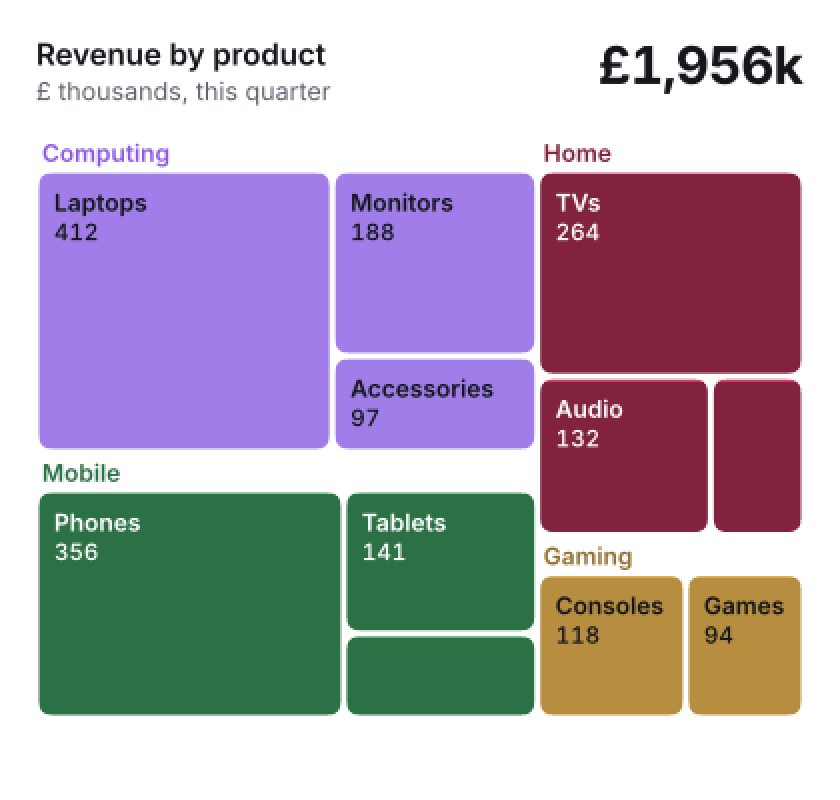
Revenue by product: the treemap chart, drawn by Hue Charts from its own sample.
Treemap
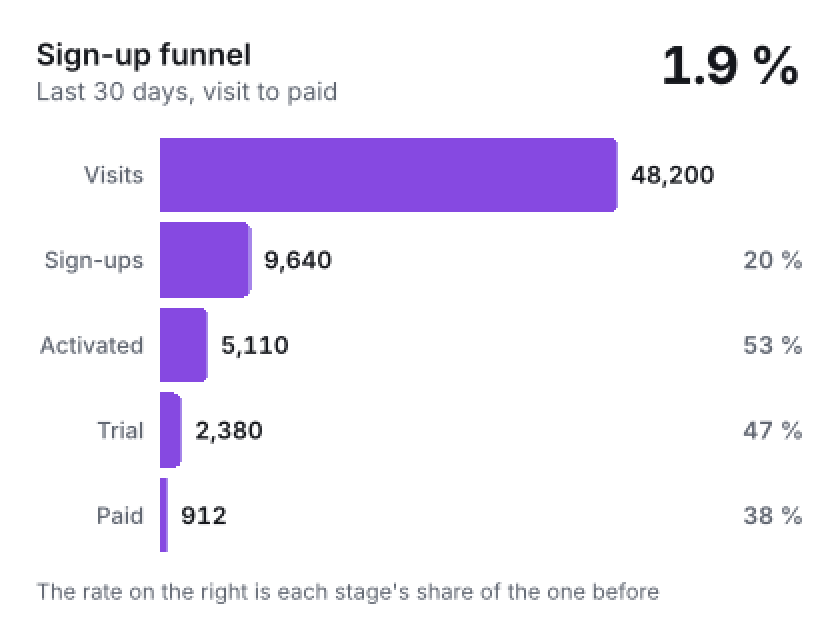
Sign-up funnel: the funnel chart, drawn by Hue Charts from its own sample.
Funnel
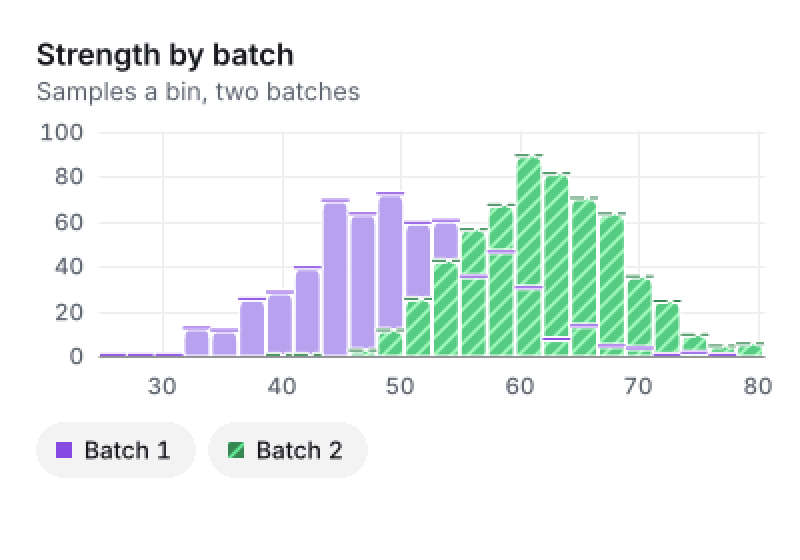
Strength by batch: the histogram chart, drawn by Hue Charts from its own sample.
Histogram
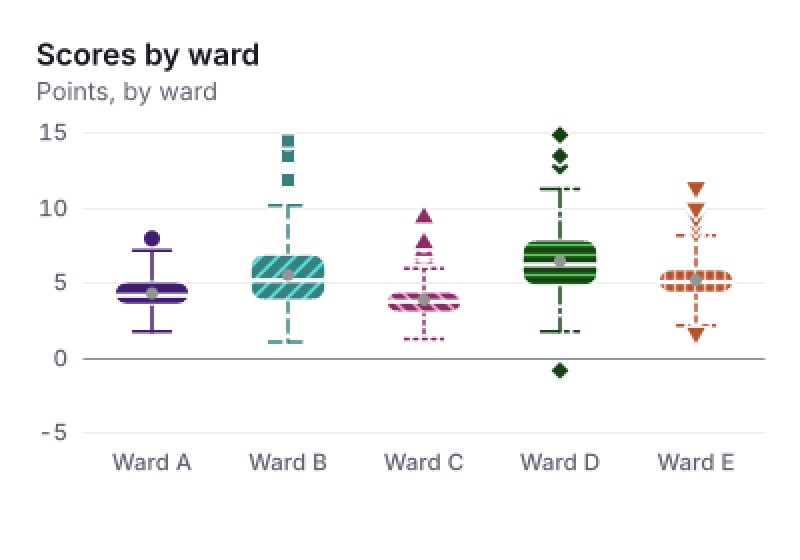
Scores by ward: the box plot chart, drawn by Hue Charts from its own sample.
Box plot
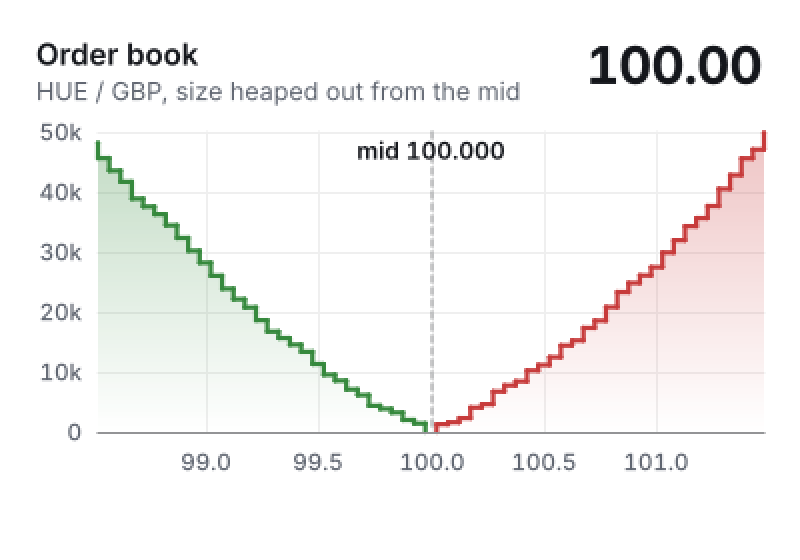
Order book: the bids and asks chart, drawn by Hue Charts from its own sample.
Bids and asks
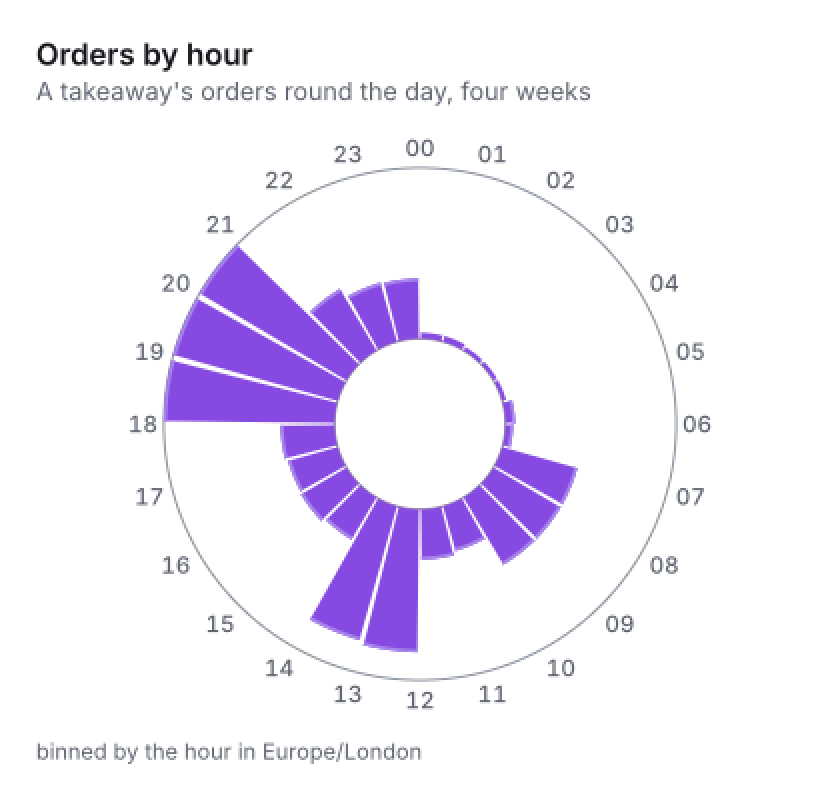
Orders by hour: the hour ring chart, drawn by Hue Charts from its own sample.
Hour ring
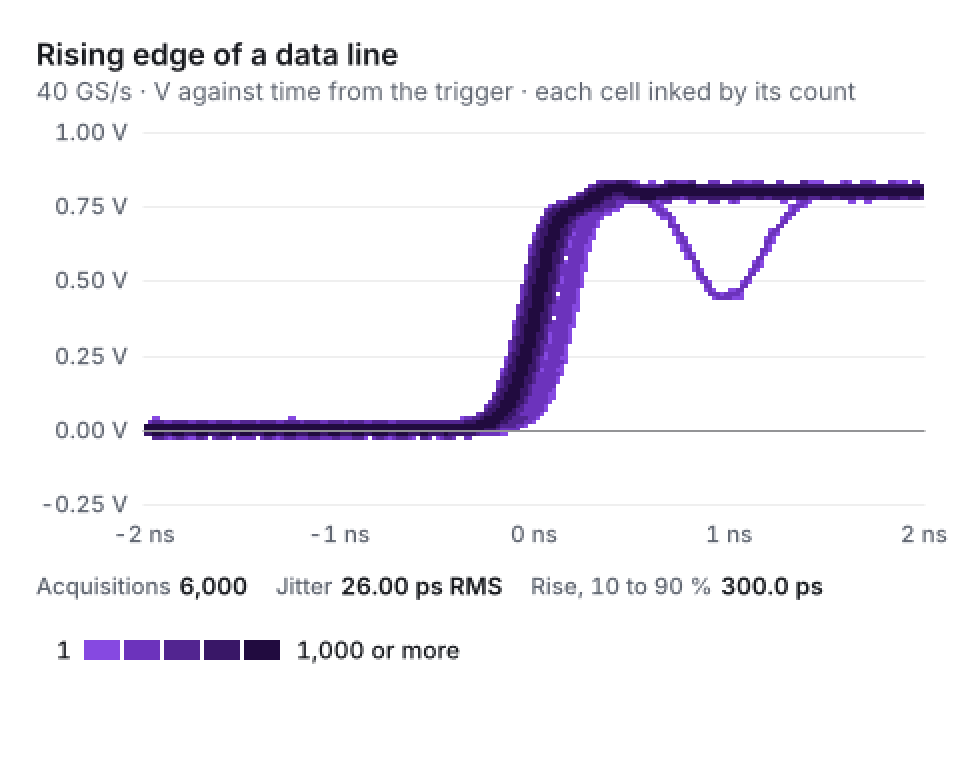
Rising edge of a data line: the persistence chart, drawn by Hue Charts from its own sample.
Persistence
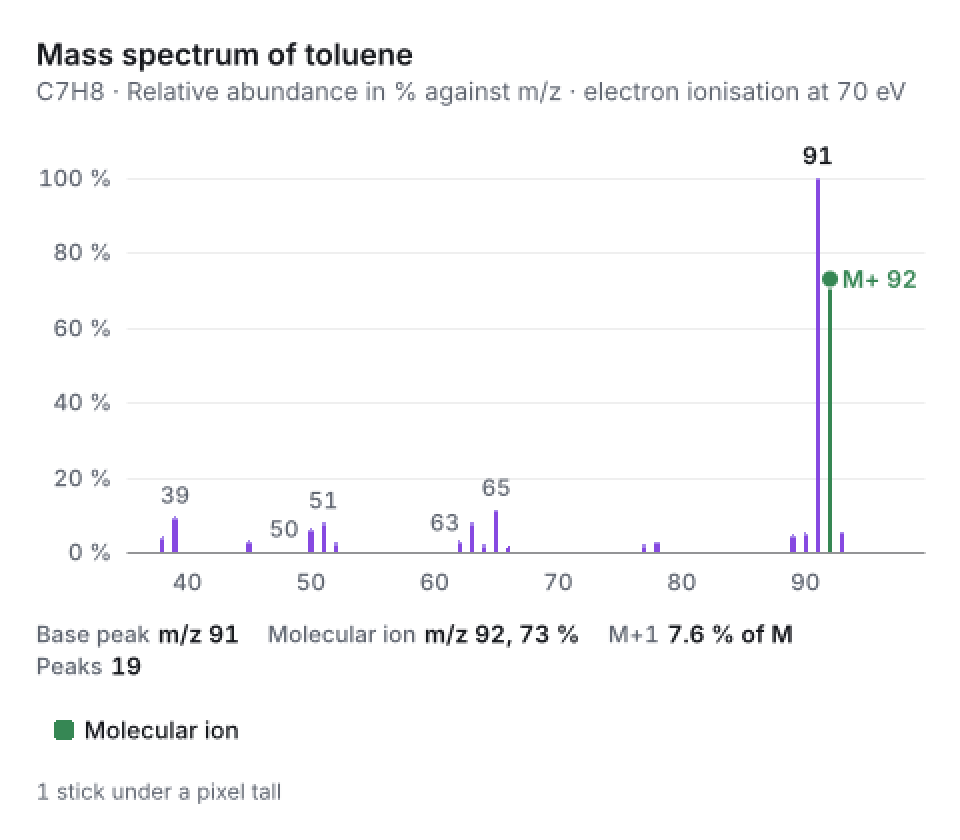
Mass spectrum of toluene: the mass spectrum chart, drawn by Hue Charts from its own sample.
Mass spectrum
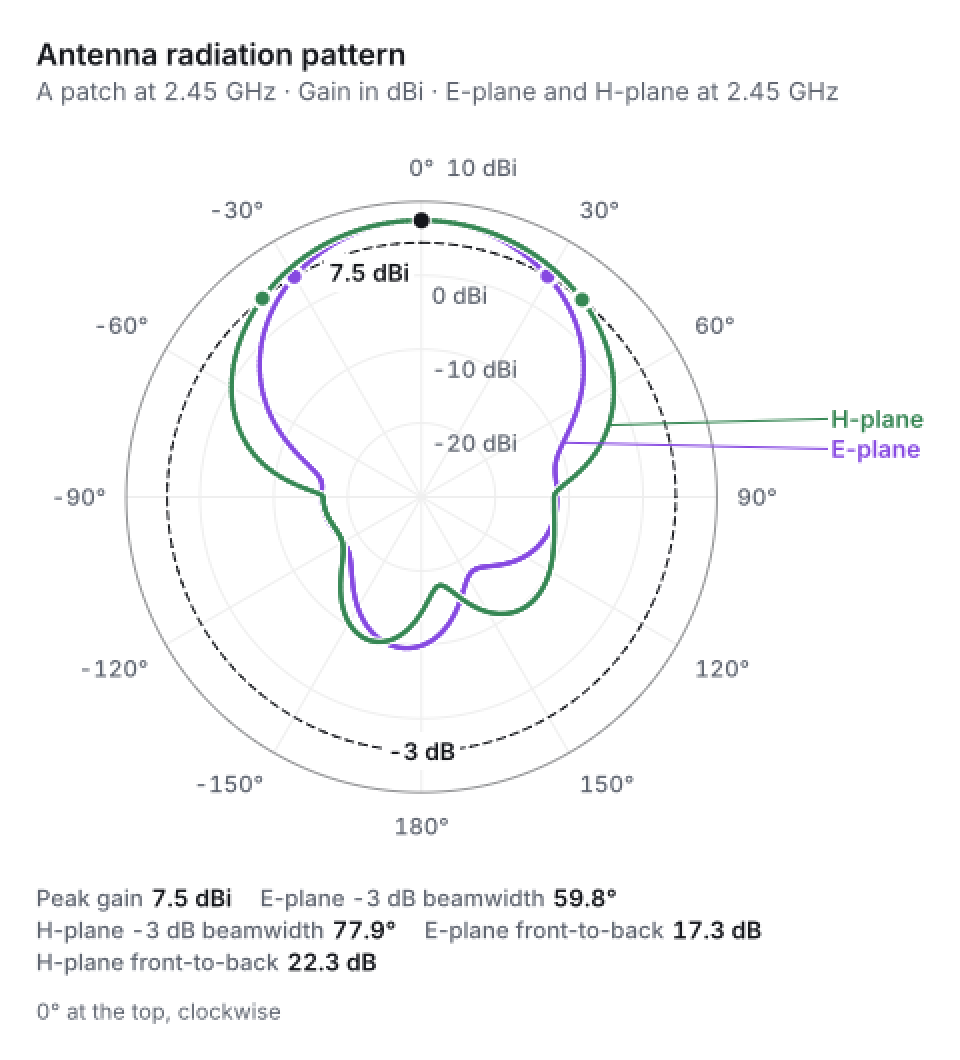
Antenna radiation pattern: the antenna polar chart, drawn by Hue Charts from its own sample.
Antenna polar
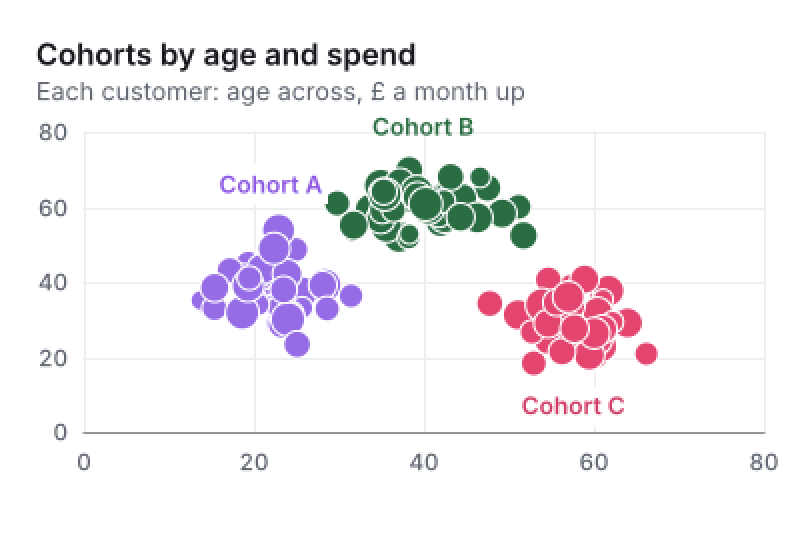
Cohorts by age and spend: the scatter chart, drawn by Hue Charts from its own sample.
Scatter
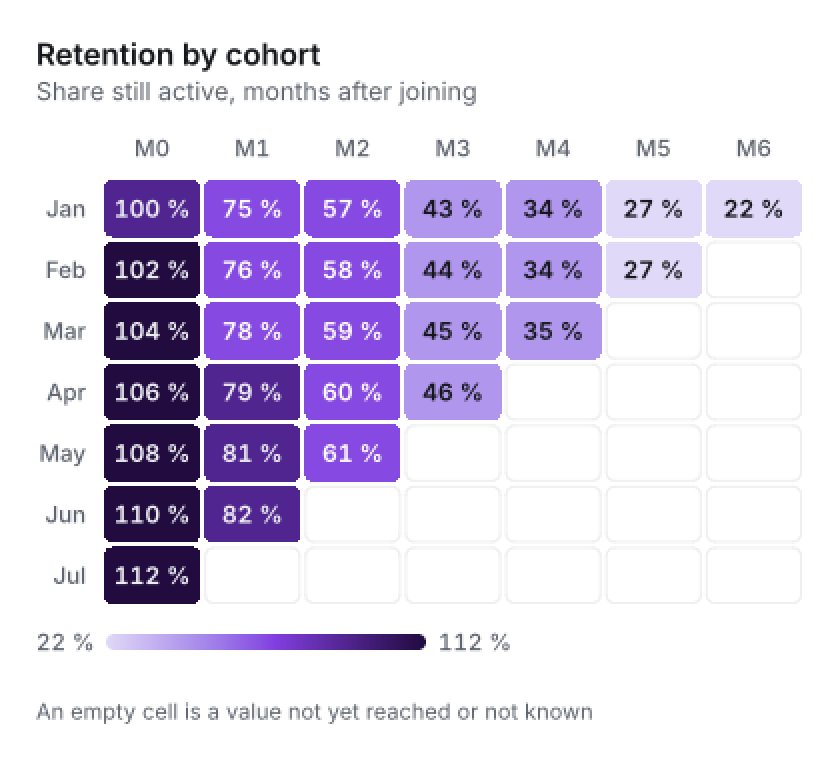
Retention by cohort: the heatmap chart, drawn by Hue Charts from its own sample.
Heatmap
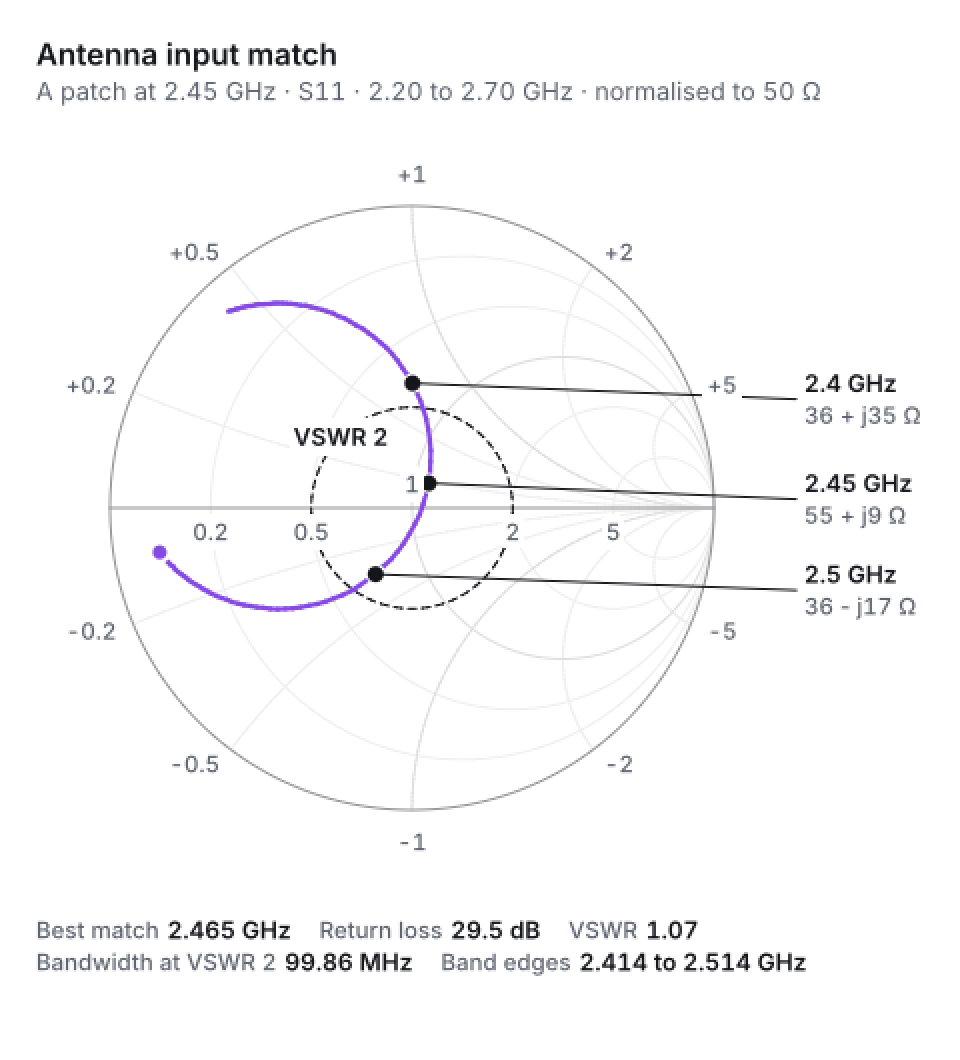
Antenna input match: the Smith chart, drawn by Hue Charts from its own sample.
Smith chart
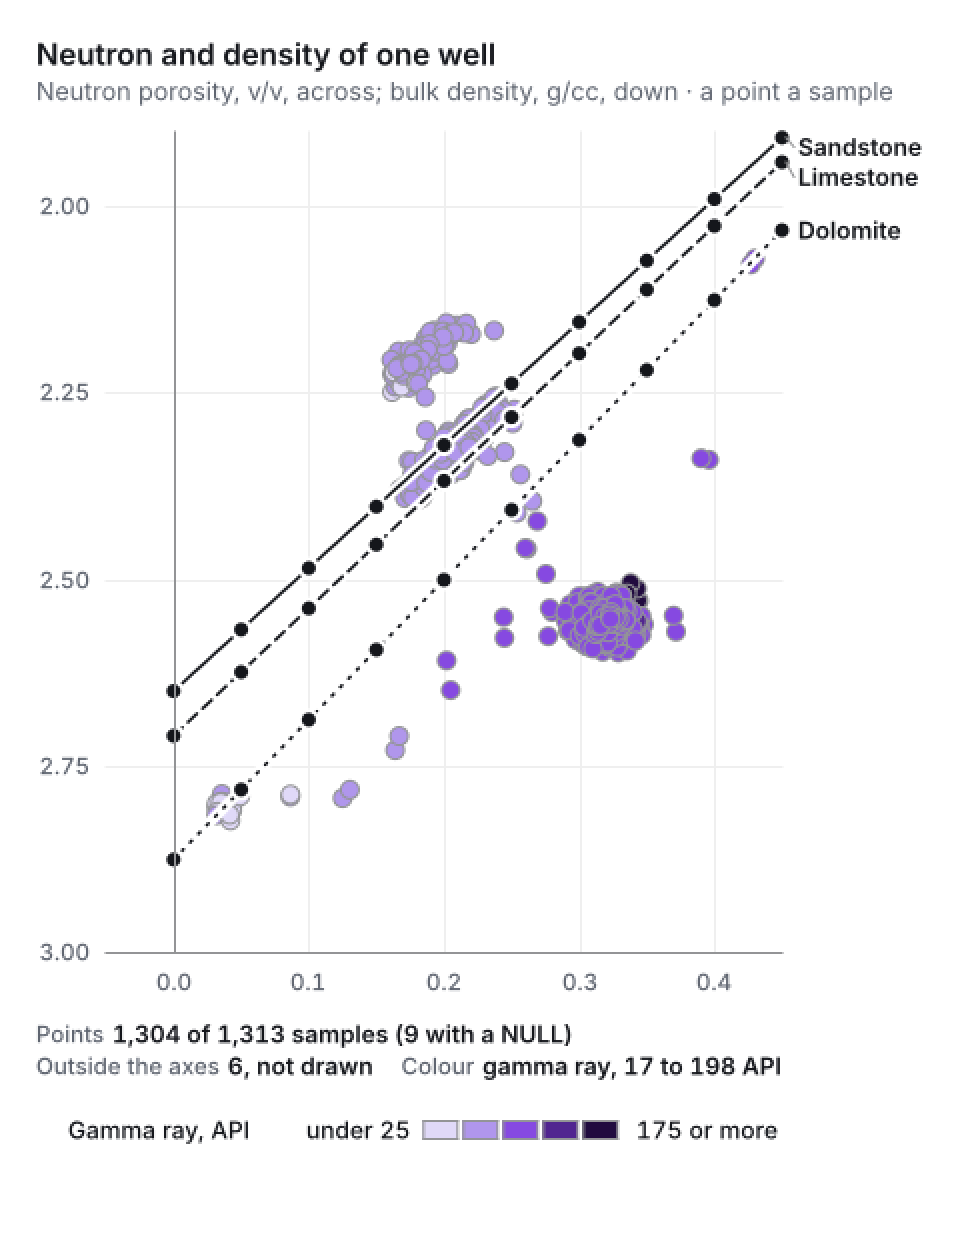
Neutron and density of one well: the cross-plot chart, drawn by Hue Charts from its own sample.
Cross-plot
A log drawn at five metres a second
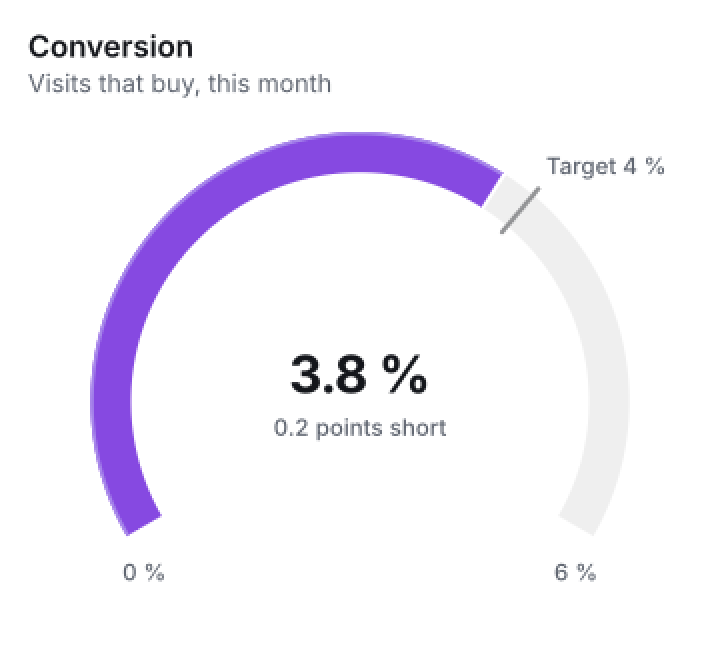
Conversion: the gauge chart, drawn by Hue Charts from its own sample.
Gauge
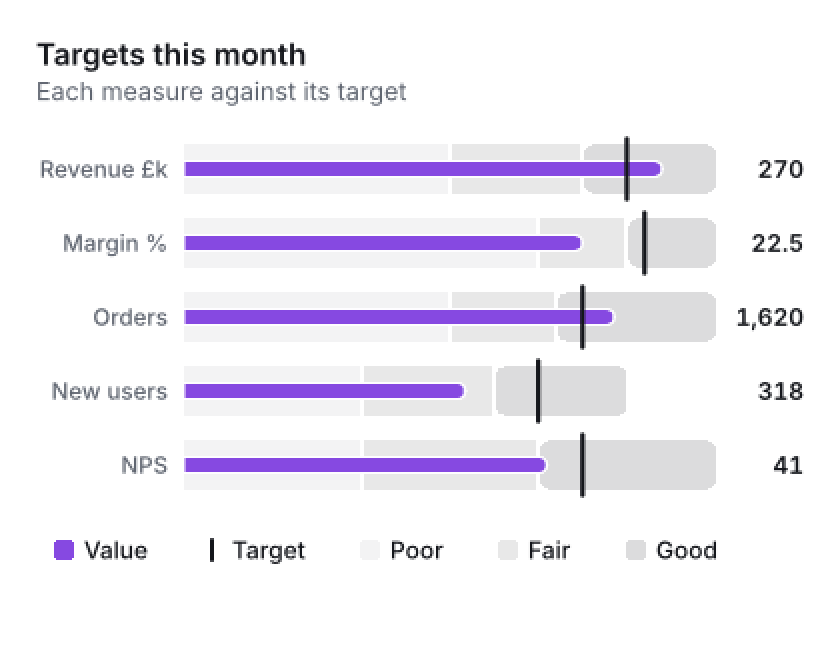
Targets this month: the bullet chart, drawn by Hue Charts from its own sample.
Bullet
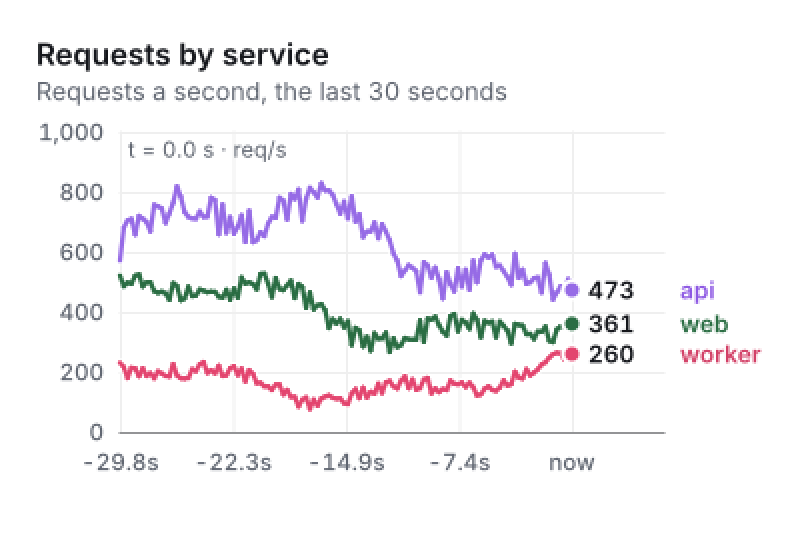
Requests by service: the live feed chart, drawn by Hue Charts from its own sample.
Live feed
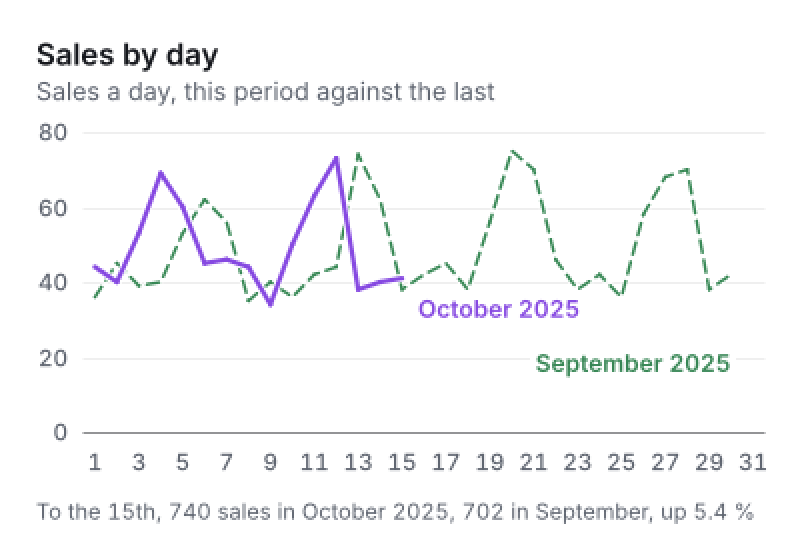
Sales by day: the period chart, drawn by Hue Charts from its own sample.
Period
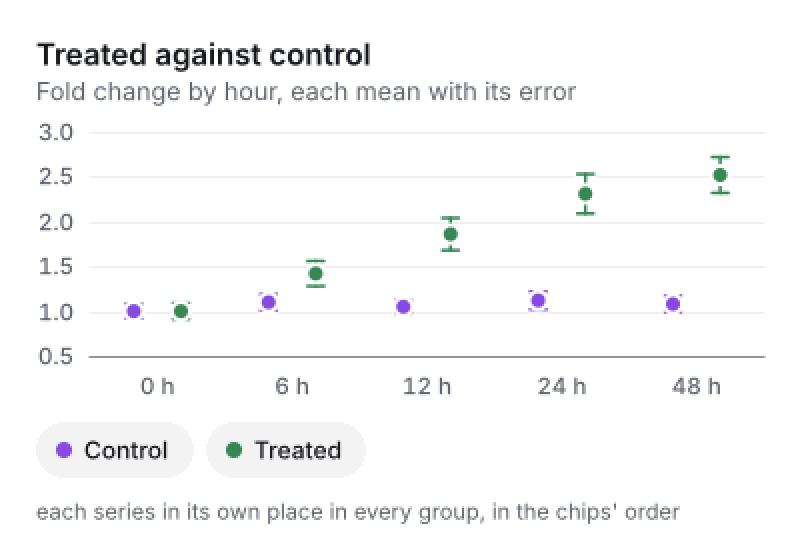
Treated against control: the error bars chart, drawn by Hue Charts from its own sample.
Error bars
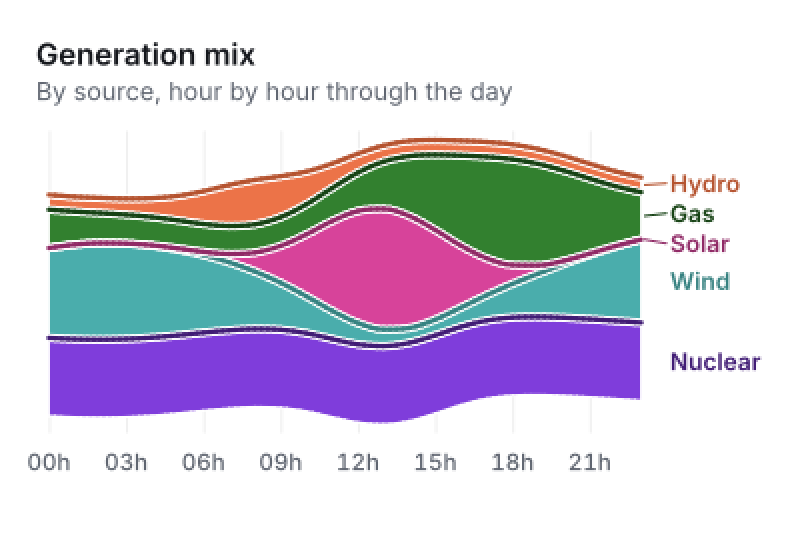
Generation mix: the streamgraph chart, drawn by Hue Charts from its own sample.
Streamgraph
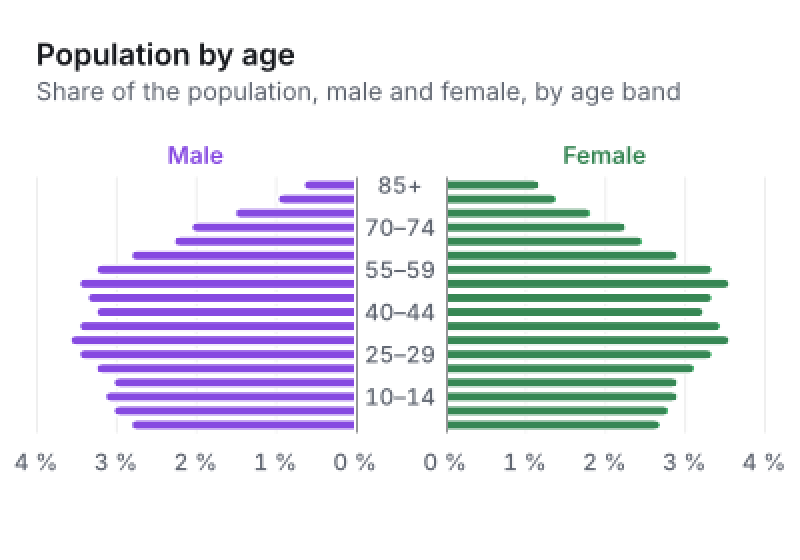
Population by age: the population pyramid chart, drawn by Hue Charts from its own sample.
Population pyramid
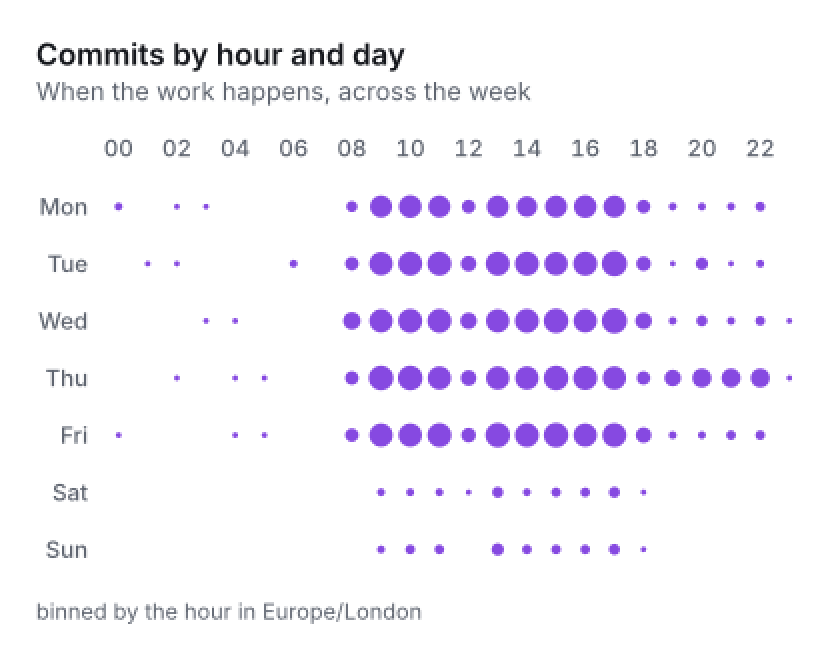
Commits by hour and day: the punch card chart, drawn by Hue Charts from its own sample.
Punch card
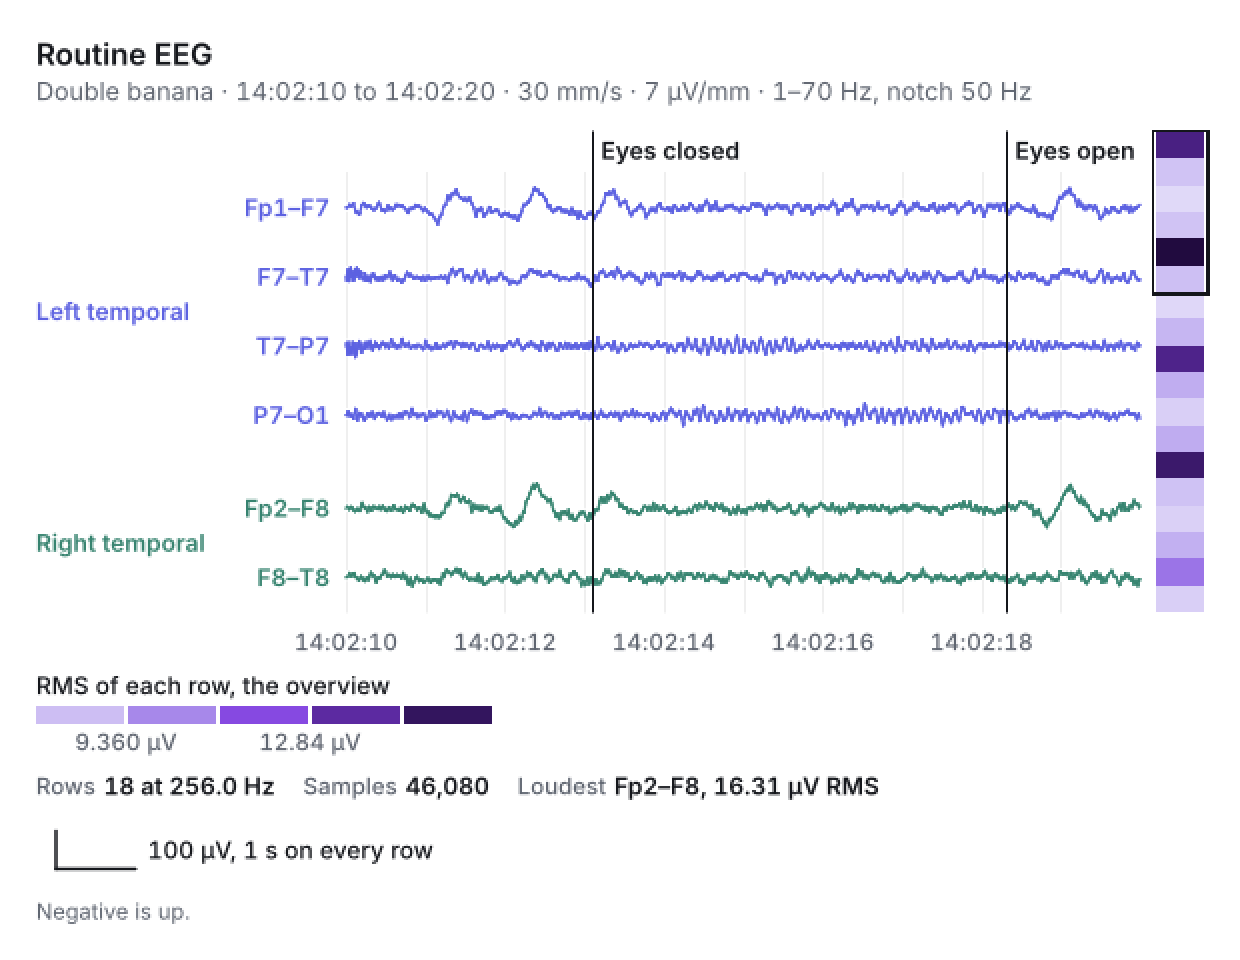
Routine EEG: the EEG chart, drawn by Hue Charts from its own sample.
EEG
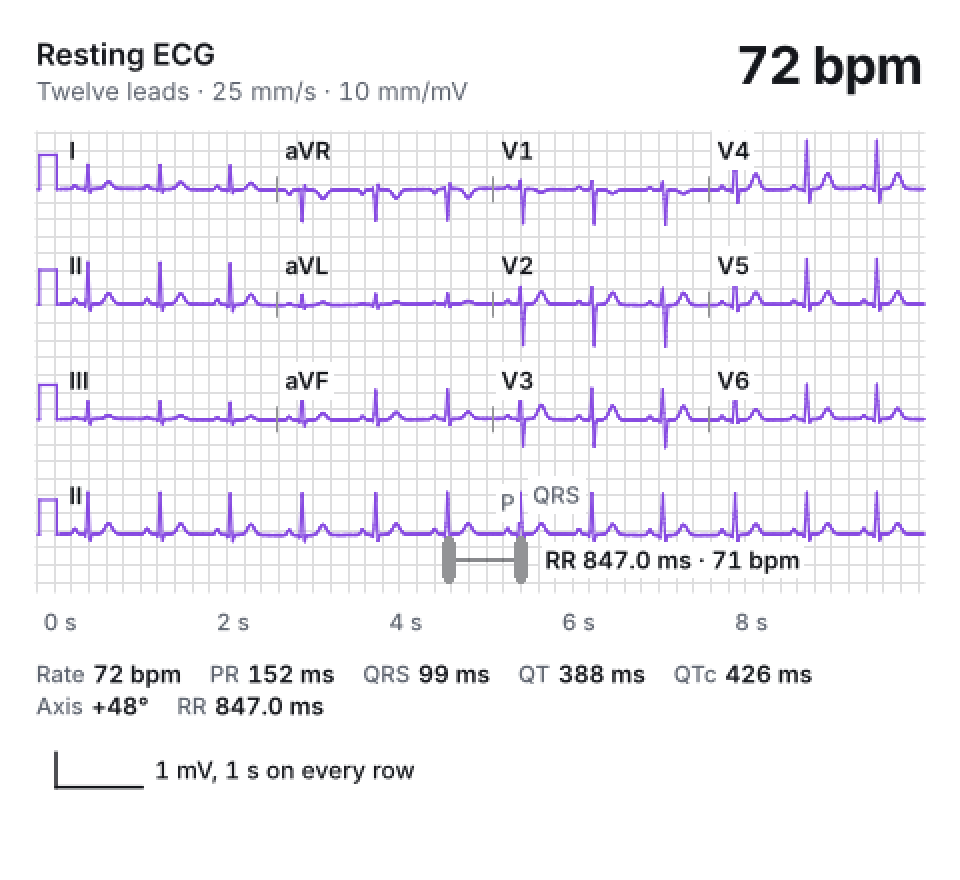
Resting ECG: the ECG chart, drawn by Hue Charts from its own sample.
ECG
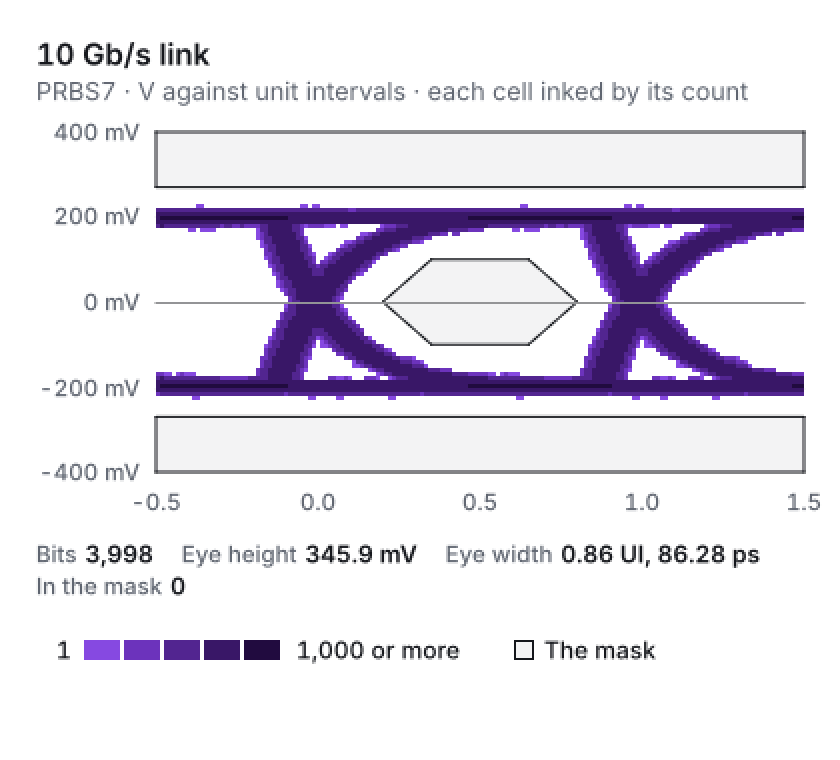
10 Gb/s link: the eye diagram chart, drawn by Hue Charts from its own sample.
Eye diagram
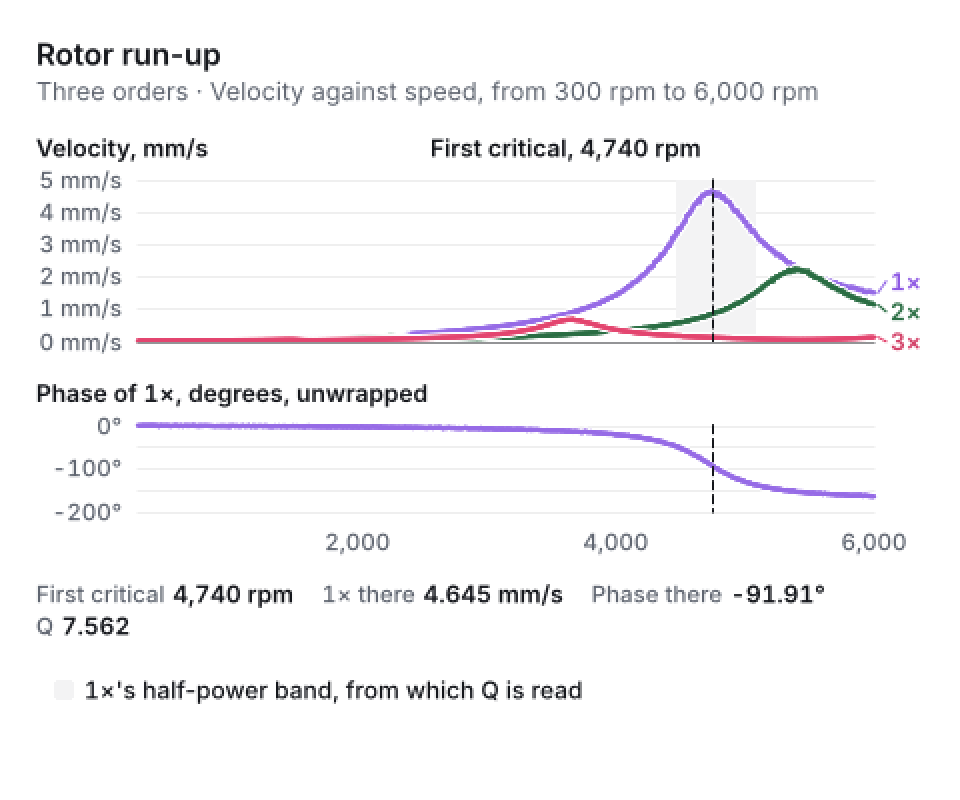
Rotor run-up: the order tracking chart, drawn by Hue Charts from its own sample.
Order tracking
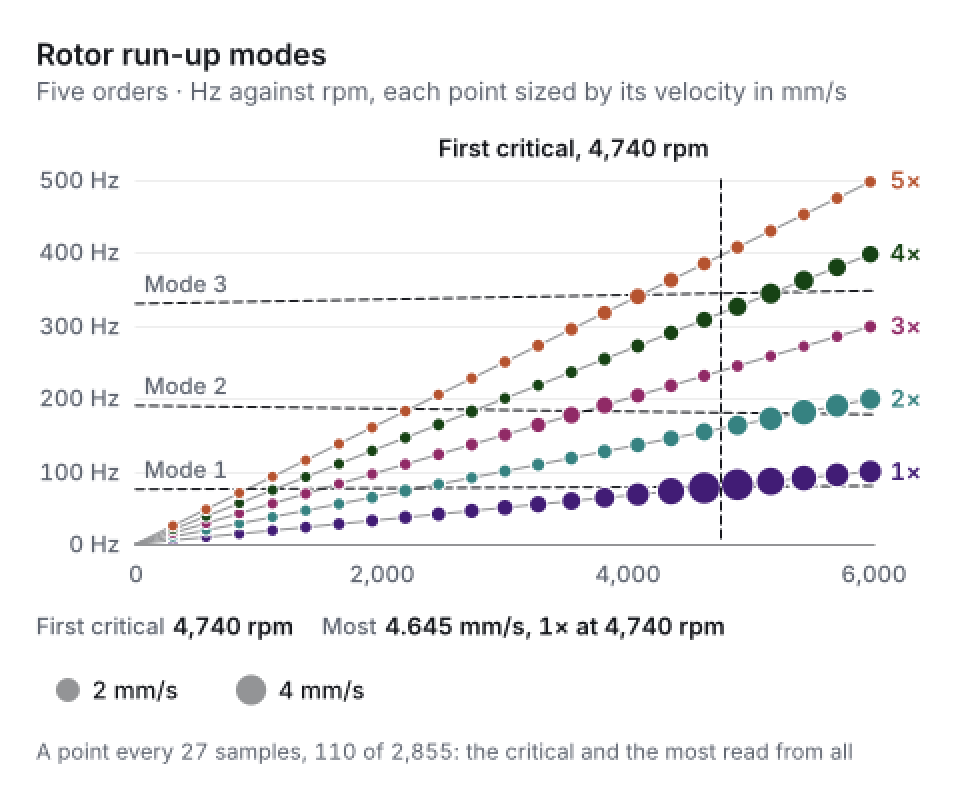
Rotor run-up modes: the Campbell chart, drawn by Hue Charts from its own sample.
Campbell
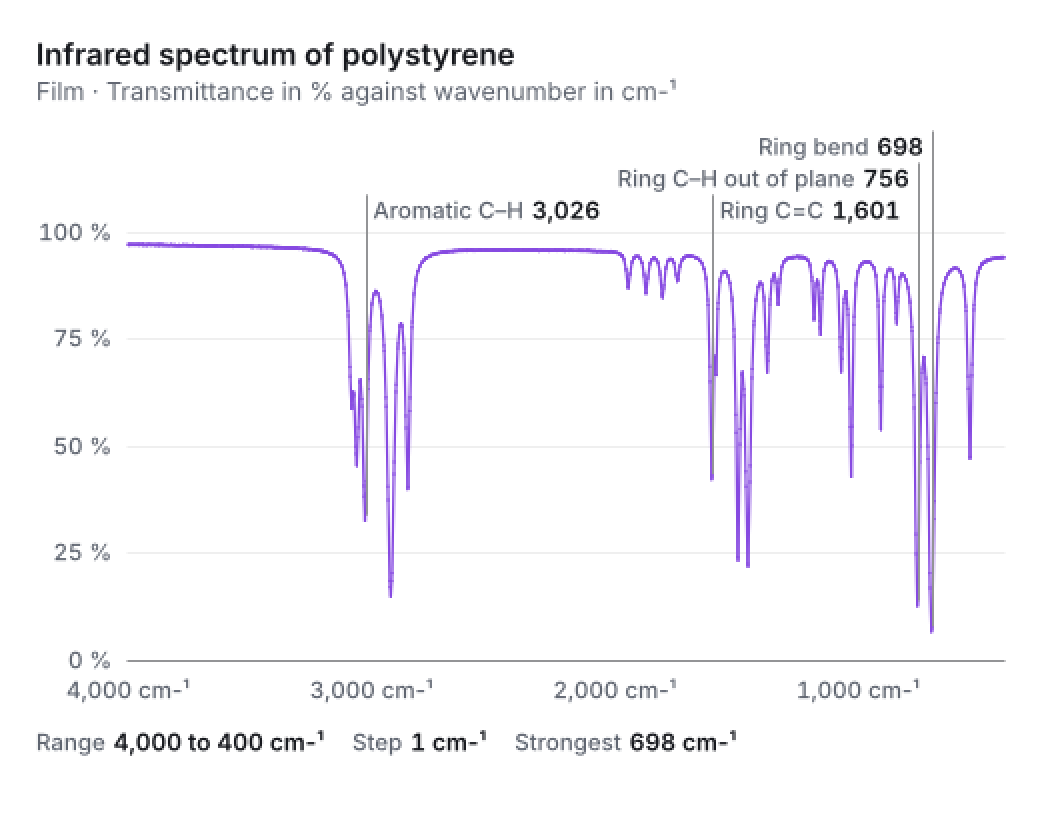
Infrared spectrum of polystyrene: the IR spectrum chart, drawn by Hue Charts from its own sample.
IR spectrum
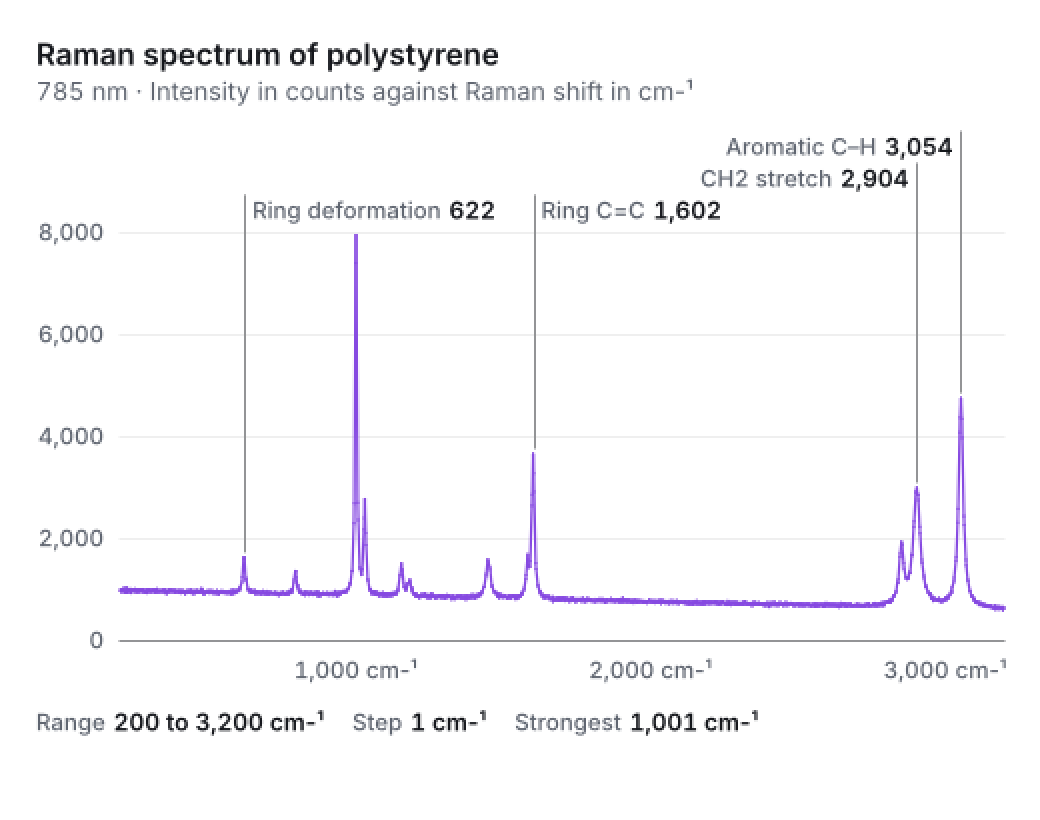
Raman spectrum of polystyrene: the Raman spectrum chart, drawn by Hue Charts from its own sample.
Raman spectrum
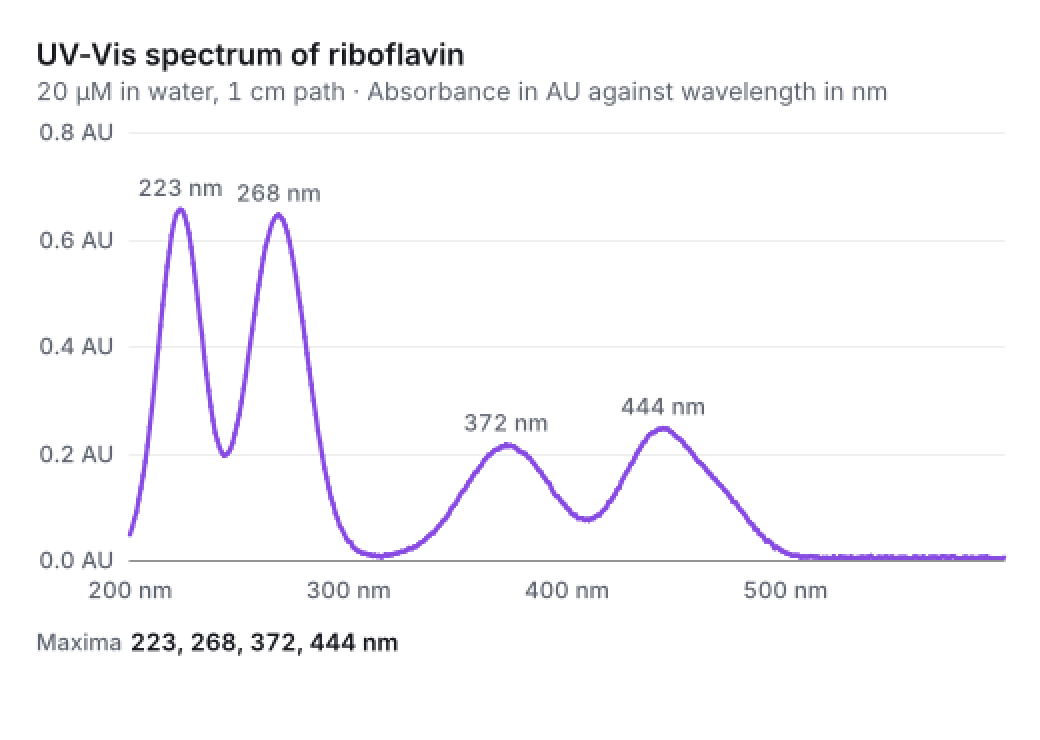
UV-Vis spectrum of riboflavin: the UV-Vis spectrum chart, drawn by Hue Charts from its own sample.
UV-Vis spectrum
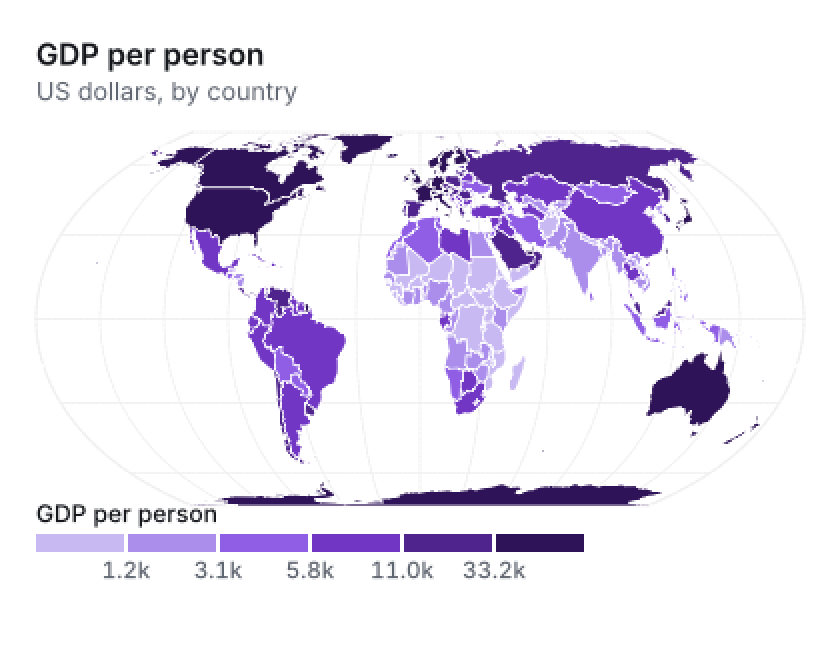
GDP per person: the choropleth chart, drawn by Hue Charts from its own sample.
Choropleth
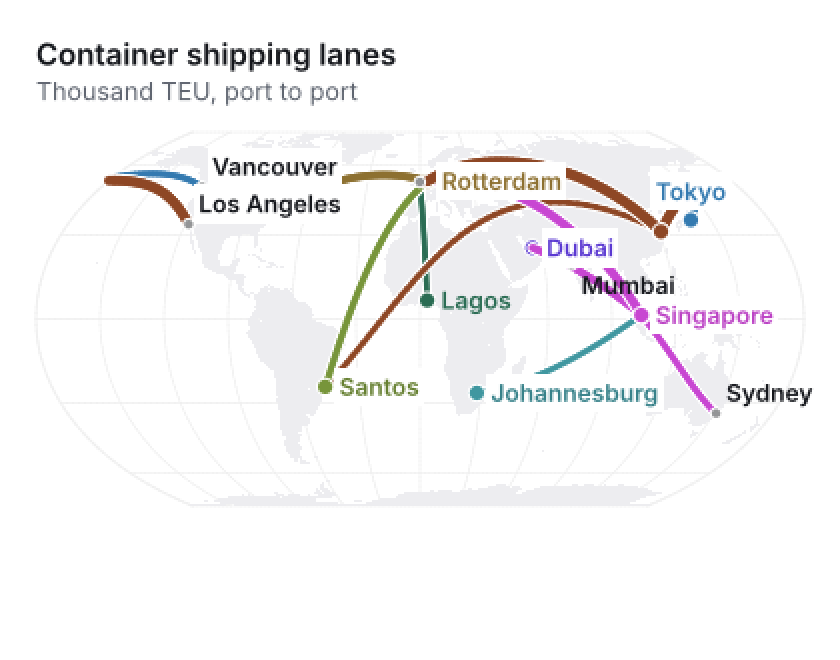
Container shipping lanes: the flow chart, drawn by Hue Charts from its own sample.
Flow
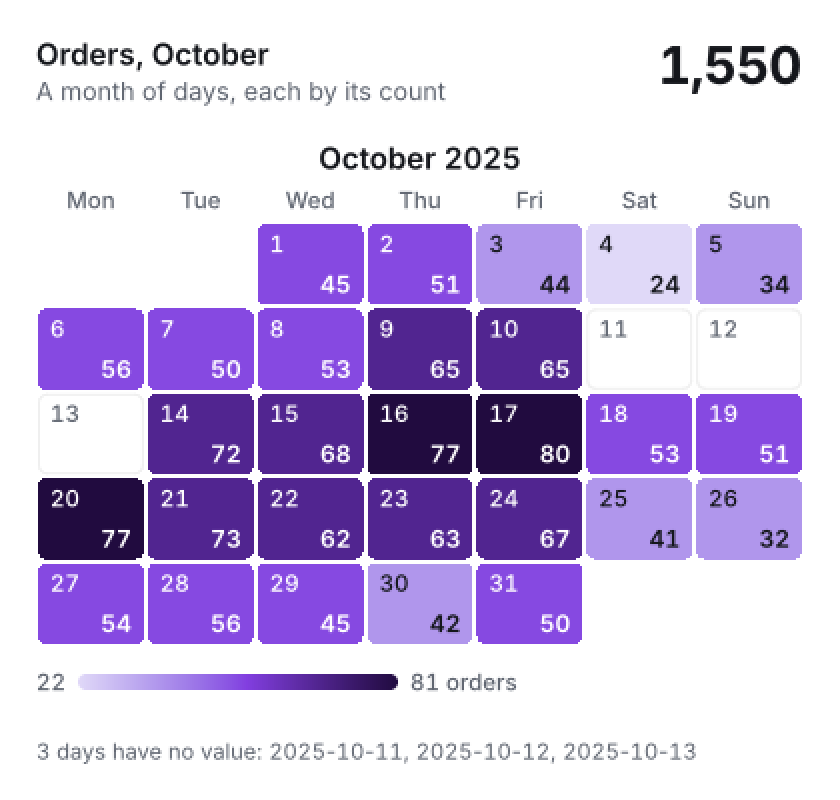
Orders, October: the calendar chart, drawn by Hue Charts from its own sample.
Calendar
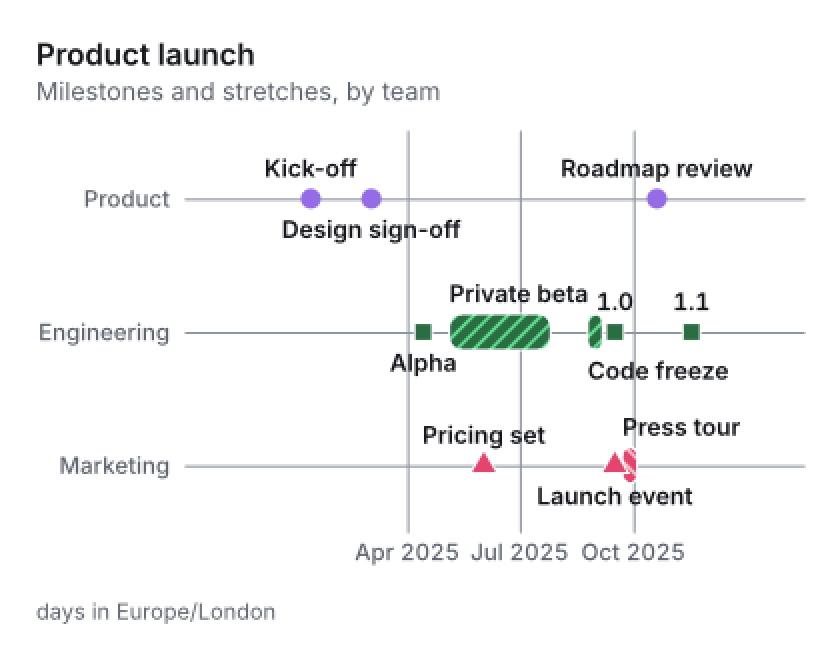
Product launch: the timeline chart, drawn by Hue Charts from its own sample.
Timeline
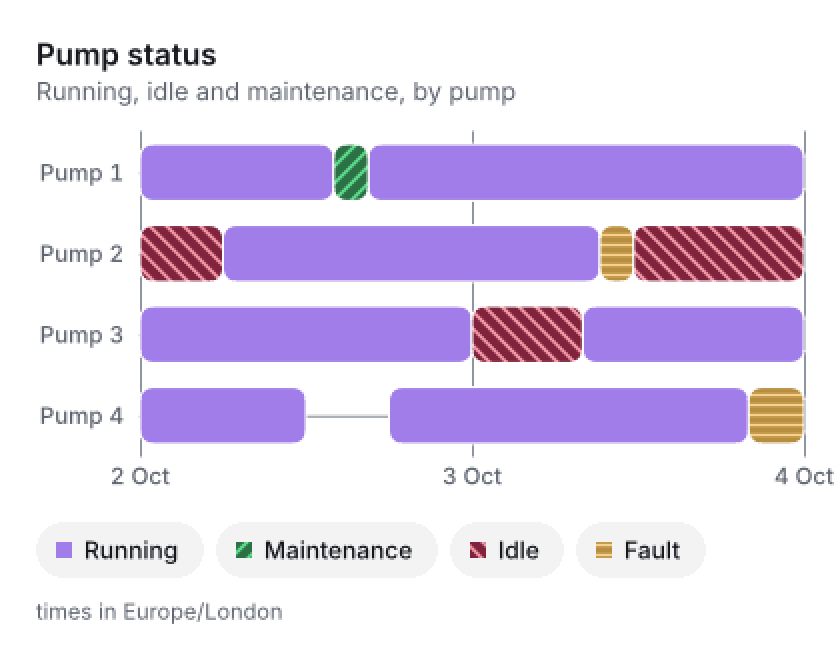
Pump status: the status timeline chart, drawn by Hue Charts from its own sample.
Status timeline
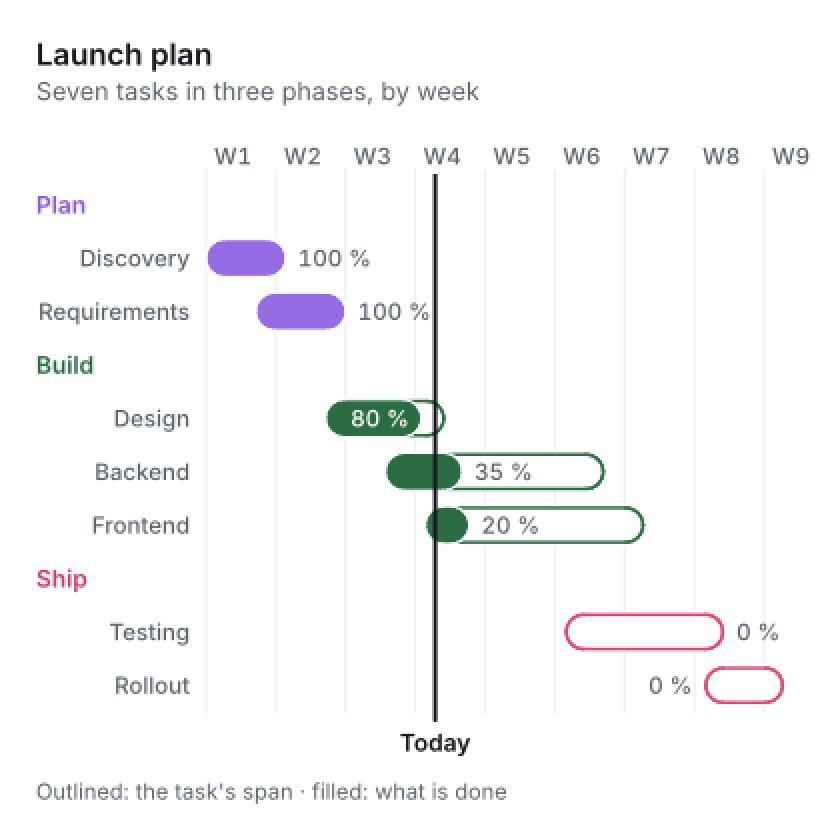
Launch plan: the Gantt chart, drawn by Hue Charts from its own sample.
Gantt
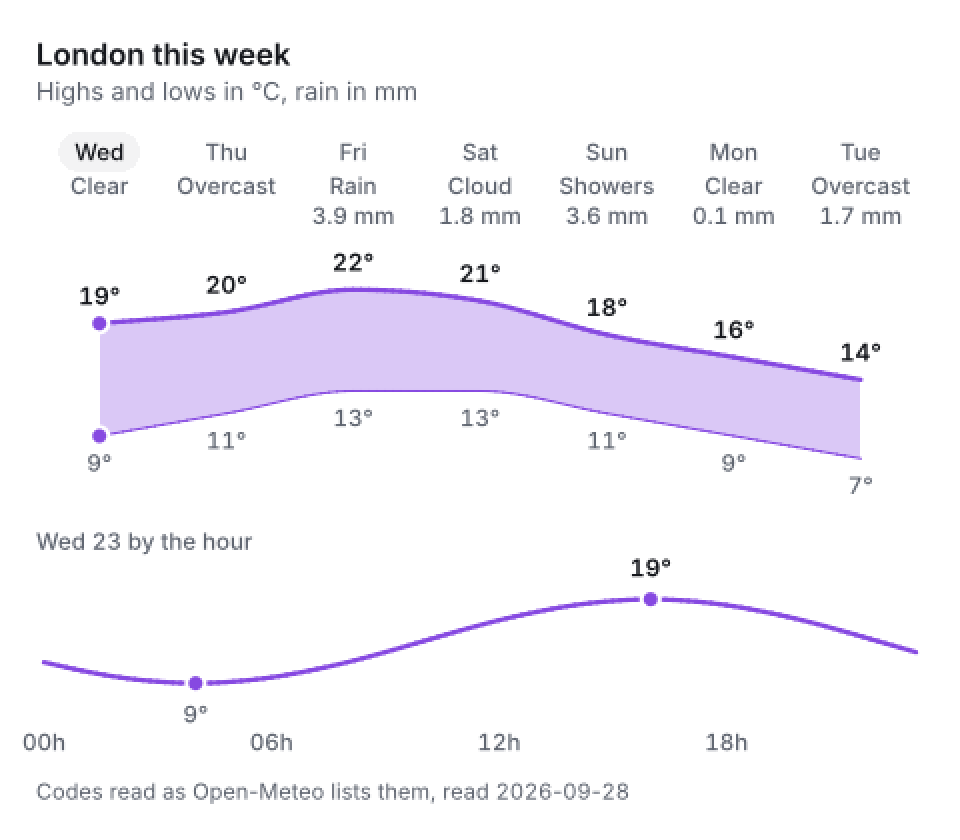
London this week: the weather board chart, drawn by Hue Charts from its own sample.
Weather board
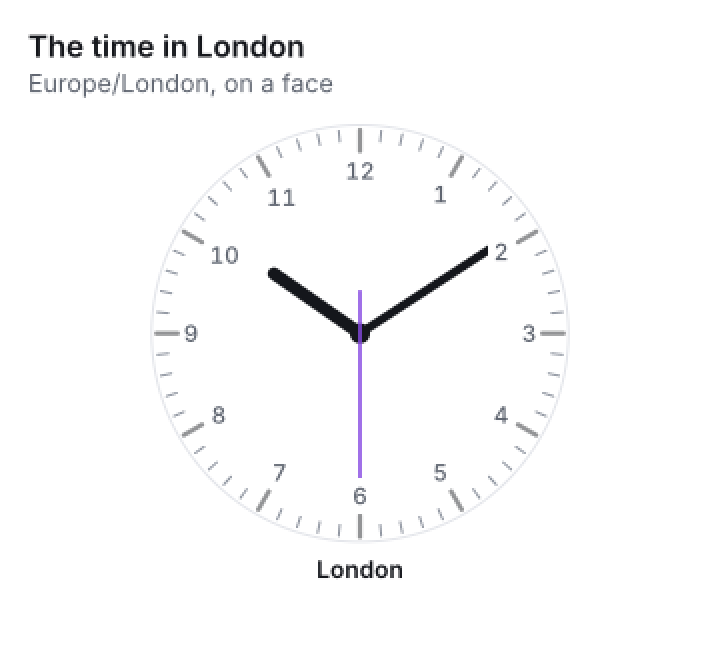
The time in London: the clock chart, drawn by Hue Charts from its own sample.
Clock
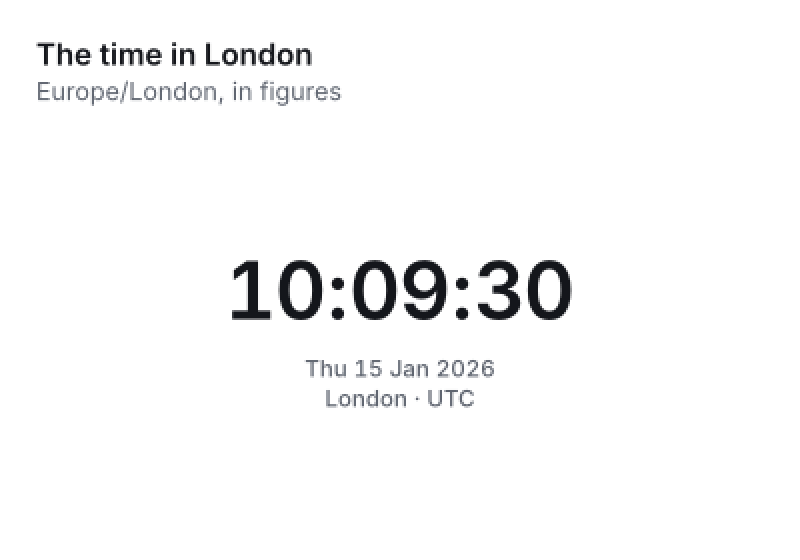
The time in London: the digital clock chart, drawn by Hue Charts from its own sample.
Digital clock
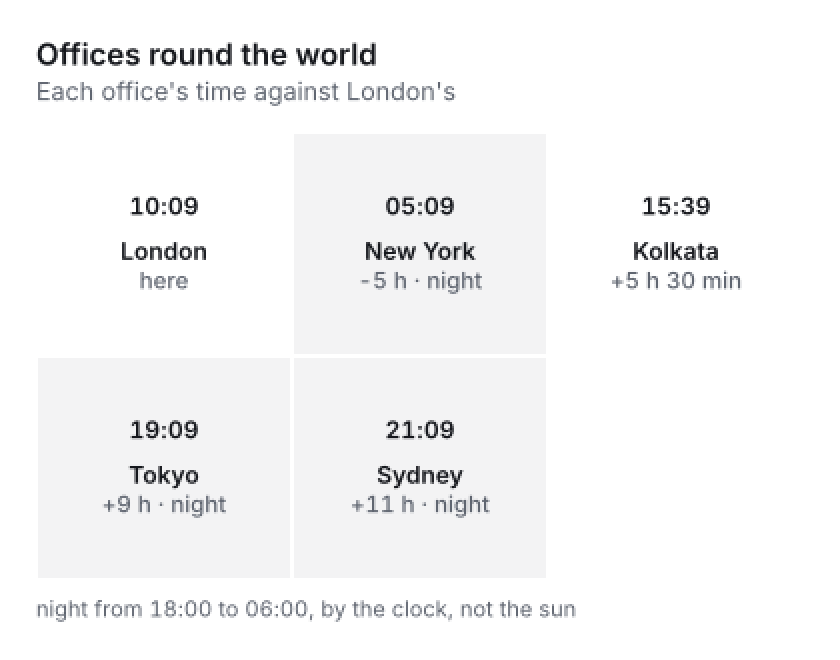
Offices round the world: the world clock chart, drawn by Hue Charts from its own sample.
World clock
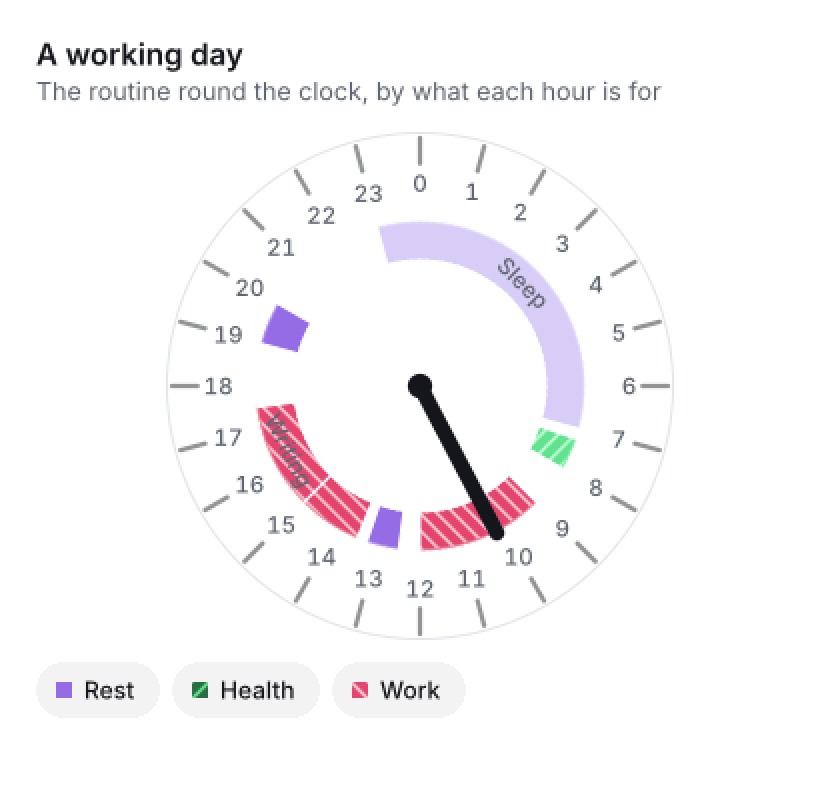
A working day: the day dial chart, drawn by Hue Charts from its own sample.
Day dial
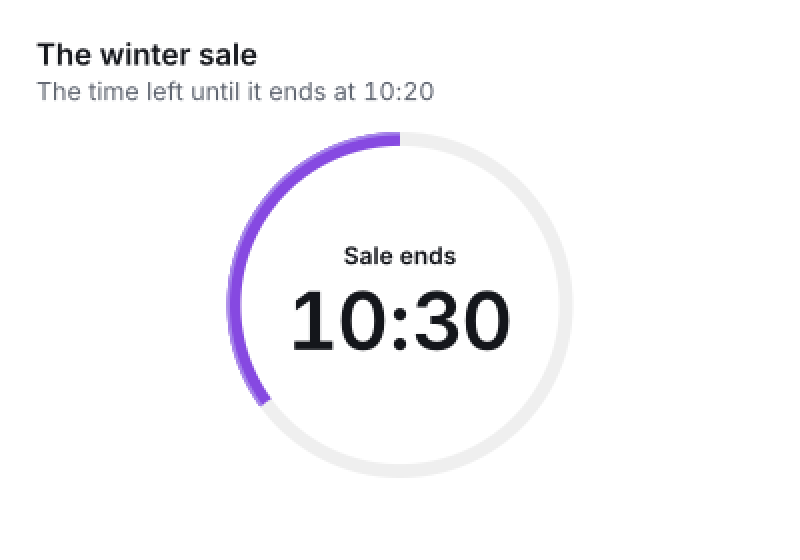
The winter sale: the countdown chart, drawn by Hue Charts from its own sample.
Countdown
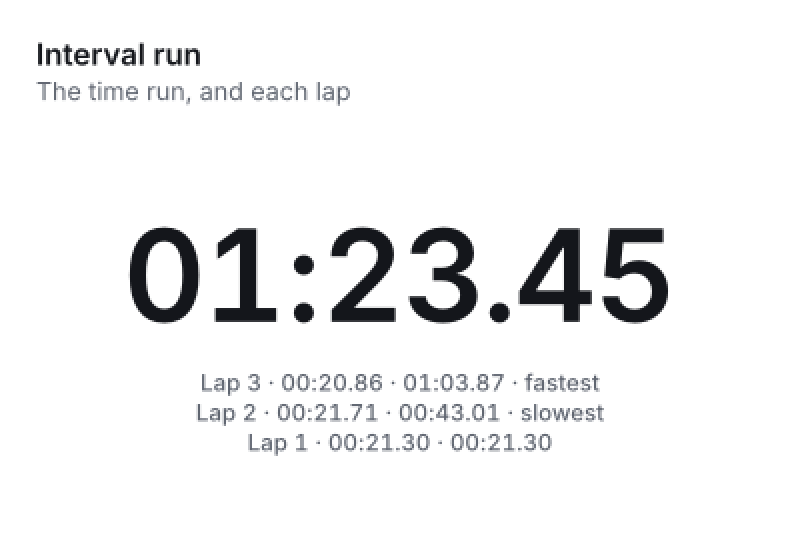
Interval run: the stopwatch chart, drawn by Hue Charts from its own sample.
Stopwatch

The brand book

One look on every chart.

The design system's own brand book: every rule of the look, in full.
Read the brand book

Hue is one look on every chart and every data component: the same card, the same type, one colour law and the same lit edge on every filled mark. A dashboard of Hue charts reads as one product. These rules are the design system behind Hue Charts and Hue Web Components, and the base huedraw.com and chromaticcoherence.ai expand on; the design itself is library/hue-charts/docs/design/DESIGN-SYSTEM.md. Take every value from tokens.json; write no literal of your own.

Content

  • Titles are sentence case and name what is measured: "Sales by region", "Revenue by product". One line, in title.
  • The context line gives the measure and the period: "Units, by quarter", "£ thousands, this quarter". Set it in context.
  • A tick carries the unit its data names: a currency's symbol in the tick's stepped form ("£2k"), any other unit after a space ("250 kg", "4 %"). The values at the marks stay bare of a unit their axis says. A unit given only in the context stays off the ticks. Ticks take k, M and B from ten thousand.
  • A delta gives the change and what it is against: "+4.2 % on Q3". The sign is in the words, so colour is never the only cue.
  • No emoji, no exclamation marks, and no words on the picture that the data did not give.

Colour

  • Every colour is the kernel's, read out from structure, or ink at a stated share (grid, chip, a bullet's bands). Its value in tokens.json is the pin that holds it, written by scripts/inks.ts and refused at every commit if it drifts. The shadows alone are typed: a shadow is the card's want of light, not a colour it wears. Never type a colour into a chart, a component or a page.
  • Series take their ring's colours in order, series-k-of-m: the kernel's seats on the ring from seed. The ring grows by a pair of seats every two series, so a chart of one to four series takes the ring of four (series-1-of-4 to series-4-of-4, its first n), five or six the ring of six, seven or eight the ring of eight. Series one is the seed's hue on every ring; the rest move as the ring grows. Beyond eight the library's law goes on; the tokens stop there. Never pick a series colour by hand, and never reorder them.
  • A series' words (its name at its end, a value in its colour) are its series-k-of-m-text: the series ink where it stands 4.5:1 on card, else that ink moved in lightness until it does. Its lit edge is its series-k-of-m-edge.
  • A host's brand colour replaces seed and is matched exactly; the compliance solve moves it only to hold 3:1, and says what it moved.
  • rise and fall only where a mark means up or down: a delta chip, a candle, a waterfall's step. Never as series. Their words on a delta chip are rise-text and fall-text on rise-tint and fall-tint, at 4.5:1.
  • A scale of values runs seq-1 (near the ground) to seq-5 (far from it): a heatmap's cells, a calendar's days.
  • Words on a mark (a tile's name, a cell's value, a slice's share) take whichever of ink and card stands further from the mark. Where neither stands 4.5:1, as on a fill of middling lightness, the word stands on a plate of card, its box and 2 px round it, in ink. So on the light ground a cell of seq-3 takes card, and on the dark ground ink.
  • Neutrals: card on page; ink for titles, figures and values; muted for labels, context and notes; faint for marks only, never words. grid for hairlines; base for the baseline and the zero line, at 3:1. band-1 to band-3 for a bullet's bands, poor to good.
  • Every word stands 4.5:1 on what it is set on, on both grounds. Every mark that carries a reading by its own colour stands 3:1 on card: a line, a point, a bar, a slice, a tile, a candle, the baseline. Three fills carry theirs another way, and are not held to it: a stacked layer's fill (its line, in the series ink, carries it), a bullet's bands (told apart by their order, poor to good, and named in the key), and a scale's cells (their lightness is their value, near the ground at the low end by design; their values are in words on the cells and in the tooltip). The series stand 4.3:1 or more on the light card and 6.4:1 or more on the dark, at every seed and every series count.
  • Charts that draw observation (the index's own) keep their dark ground and their observed lightness in every theme. They take no lightness step and no lit edge.
  • A colour a picture draws on ink, or under it, wears its on-ink step (muted-on-ink, series-k-of-4-on-ink, series-k-of-4-edge-on-ink): its light-ground value moved in lightness until it stands 3:1 on ink and, for a seat or muted, on its tint, so on the light ground it is the colour itself. ink never moves (DESIGN-PICTURES-DARK.md).

Type

  • One face, Inter, with tabular figures on every number: headline (the card's figure), title, context, label (ticks and axis words), value (end labels, values on marks, tooltip figures, the delta), chip-text, note.
  • Text is measured by the face's own widths. Nothing is counted in characters, and nothing is set in a monospace.
  • Tabular figures go on numbers only, never on words: Inter's tabular set widens the hyphen too ("Sign-ups").

The card

  • Every chart sits in a card: card surface, a 1 px line outline, radius-card, shadow-card, padding space-card (space-card-narrow below 400 px). A host whose container is already a card turns card off. The anatomy stays the same, with no surface, outline or shadow. Power BI does this by default.
  • From the top: the header (title and context on the left, the figure and its delta chip on the right); the plot (value ticks on its left, series names on its right); the key and the chips; the foot (notes and the source line); then the mark row and the controls row where they apply. A region a chart leaves empty collapses.
  • The figure belongs to the host: given as text, or asked for by a rule the chart answers (last, total, share). No chart shows a figure nobody asked for.

Marks

  • Columns and bars: the value end rounded radius-bar, the baseline end square, whichever way the bar points. A stack rounds only its outer end. Bars fill size-band of their band, and a group's bars stand space-part apart. Crisp, the host's other shape, squares every corner and keeps the gaps.
  • Parts that touch stand space-part apart with the card showing between them, never a stroke.
  • Lines: stroke-line, round joins and caps, straight from point to point unless the chart asks for a curve: smooth is a monotone curve through the points, never past them, and step is steps. Points are hidden except the last (size-point, ringed in card) and on hover or focus. A line that crosses filled marks (a combo's) is cased in card, space-part clear on either side.
  • Areas: the line, and beneath it the series ink, from opacity-area at the line to nothing at the base. A stacked area's layers, and a streamgraph's, fill in their series-k-of-m-edge, each carrying its line in the series ink.
  • Donut: the hole size-hole, the whole in the centre in headline. A donut's slices and a gauge's arc are square at their corners in either shape.
  • Candles: the wick a hairline, the body in rise or fall; a candle that closed up is hollow, its outline at stroke-edge, and one that closed down filled, so the shape says it as well as the ink. A body shorter than four times stroke-edge is drawn that tall about its middle, so the hollow always shows.
  • Tiles radius-tile, cells radius-cell.
  • The lit edge: every filled mark carries stroke-edge along its value end in its series-k-of-m-edge, its own ink lit by the kernel's light law. The value end is a column's top, a bar's far end, a negative bar's foot, an area's line, a tile's top and a slice's outer arc. There is none on a fill whose lightness is its value (seq-*) and none on charts that draw observation.

Grid and axes

  • Horizontal hairlines in grid at the value ticks; the baseline in base; no value axis line, no tick marks and no frame round the plot. A scatter keeps both grids; a chart laid across keeps vertical hairlines.
  • Four to six ticks a value axis, in label, space-tick from the plot.

The chart names itself

Every chart of two series or more tells them apart by something besides colour, in this order:

  1. Names at the marks: a line or an area at its end, in its series-k-of-m-text, names at least space-label apart, with a 1 px leader where one moved, at every width; stacked columns beside the last stack; a donut's, treemap's or funnel's parts on the parts; a scatter's groups at their points, a treemap's groups along their blocks and a Gantt's phases over their tasks.
  2. The place: in grouped columns every series keeps its place in every group, the chips name them in that order, and the first group's bars carry their names where they fit.
  3. The pattern: for what neither tells apart, a dash for a line, a marker for a point or a fine hatch for a fill, only where it is needed.
  4. Refused: where even that cannot hold, the chart refuses the room and names the size it needs.
  • Chips: size-chip tall, chip-text in ink on chip, a size-chip-dot dot in the series ink, radius-chip, space-chip apart, one row under the plot, wrapping. They appear only where the chart does not name its series at their marks. A chip switches its series: when hidden, its dot turns hollow in faint and its words muted. Where the series are named at their marks, the name is the switch.
  • The key explains what marks or a scale mean, never series: mark meanings set like chips that are not pressable, or a size-key-ramp ramp of seq-1 to seq-5 with its ends' values in label.

States and motion

  • Hover and focus: the series stays and the rest go to opacity-dim. The tooltip card (card, line, radius-tooltip, shadow-tooltip) shows the category and every series' value in drawn order, each with its dot. It stays while the pointer is over it, and Escape dismisses it.
  • Focus: a stroke-focus ring in ink, 2 px off the mark; the arrow keys move from datum to datum. Pressed: ink at opacity-pressed behind the chip or name.
  • Empty: the header stays and the plot says "No data for this view" in note.
  • Enter over duration-enter on easing-enter, categories duration-stagger apart. A change of data morphs over duration-morph on easing-morph. Nothing moves when the reader asks for reduced motion.

Sites on Hue

Every site on Hue (huedraw.com, chromaticcoherence.ai, the team site) shares these rules through the site system, so the sites read as one family. The components Hero, Icons, Zones, Forms and Account show them.

  • A zone is a part of a site that wears one product's colour: its seat on the ring of four (series-k-of-4), that seat's edge (series-k-of-4-edge) and its tint (series-k-of-4-tint). The house wears ink, muted and ink-tint.
  • Each tint is the kernel's: the zone's ink over card at 14 %, as rise-tint is, derived by scripts/inks.ts and pinned. A seat stands 3:1 on its tint on both grounds. No word stands on a tint, and an edge is never a mark.
  • The seat colours a zone's icons, the bar that leads its kickers and footer headings, the current menu item's underline and a link's underline. The tint is the ground of its icon tiles and its hero's picture. Words stay ink and muted.
  • Every page opens on a hero of its own, and no two pages share a picture. A product page shows the product, one of the library's own charts in its own colours. Every other page draws its subject as blocks in its zone's family: its seat, its edge and ink, with no other zone's seat. Only the home mixes zones, one block for each, and its picture cards may each stand in a seat of their own, one card a seat, the card wearing it. The house's other pages draw in ink and muted.
  • A composition's cut, gap or ring through a block is ground, the colour the picture sits on. A chart sits inset in the cell and never scales up. The picture is decoration: the page's words carry its meaning.
  • A picture follows the theme. Where its seat, edge or muted meets ink, that colour wears its on-ink step on every shape of it in the picture, a seat with its edge, and every two colours that meet stand 3:1 on both grounds, but a seat with its own edge and an edge with the ground. The site system's law (pictureContrastFaults) holds it.
  • A picture whose ink stands for the unobserved (the prologue's room, piece 6's board) stands on observation's ground on both themes: its cell and ink the dark ground's card, its cuts that ground's ink, so its dark stays dark.
  • The icons are one set of line glyphs (icons.json): a 24-unit grid and a 2-unit stroke, round caps and joins, each glyph meaning one thing. A site's own glyphs are drawn in the same frame.
  • An icon sits on a tile of its zone's tint at radius-icon-tile: size-icon-small on size-icon-tile-small in an eyebrow and a menu item, size-icon on size-icon-tile on a card or a strip. No list repeats an icon.
  • The bar that leads a kicker and a footer heading is size-zone-bar long and stroke-zone-bar tall, at radius-chip, in the zone's seat.
  • A members' form puts a real label over every field, never a placeholder in its place, its field on card with a base edge and its words at 16 px; one solid button; a provider below a rule; and its answer beside it on chip, a refusal led by the said-wrong mark and never coloured.
  • An account gives each thing a member manages its own panel, its kicker in the zone. A money state is said as the store has it, never ahead of it, and a control the member may not use is not offered.

Science

What Hue Charts for science draws (library/hue-charts/docs/design/DESIGN-SCIENCE.md) stands on these tokens and four more rules.

  • A waveform at four samples or more a pixel column takes stroke-signal; fewer keep stroke-line.
  • A waveform at a physical scale stands on the mm grid: a line each millimetre in grid, each five in grid-major.
  • A density's cells (persistence, the eye diagram) take the count steps, count-1 (1) to count-5 (1,000 or more), by decade. A cell with any count is a mark, so count-1 stands 3:1 on card and on chip over the card.
  • Cursors and calipers stand on handles as the navigator's, size-handle in base; measurements stand under the plot before the key, name in label and muted, value in value, with no pill. A strip chart's rows are size-row at least, their groups space-group apart; panes stand space-pane apart; a live waveform that overwrites leaves space-erase ahead of its pen; a density's cell is size-count-cell.

Expanding on it

A product adds its own layer on these tokens (a site's navigation, its marketing type) and does not redefine them. What every site on Hue shares stands in "Sites on Hue"; a site's own navigation and marketing type stay its own. A change to a value here is made here first, its colours through scripts/inks.ts, and shown on the boards before it is taken.
Colour

Every colour, on both grounds.

Each row of tokens as it looks on both grounds. Open a row for each token's value and use.
seed · 1
seed
TokenLightDarkUsage
seed#8b42f0#8b42f0The default seed: the Hue mark's zero point (apps/huedraw/app/globals.css). Series one is its hue at every series count; a host's brand colour replaces it.
ground and ink · 12
ground and ink
TokenLightDarkUsage
page#f3f4f6#0b0c0fBehind the cards, where the host draws a page. Structure at OKLCH 0.967 / 0.003 / 264.5 light, 0.155 / 0.007 / 271 dark.
card#ffffff#15171bThe card's surface, and the gap between parts that touch (stack segments, slices, tiles, cells). A word on a mark takes card where it stands further from the mark than ink does; where neither stands 4.5:1, the word stands on a plate of card.
line#e3e5ea#262930The card's 1 px outline and the tooltip's.
gridrgba(20, 22, 27, 0.07)rgba(236, 238, 242, 0.08)Grid hairlines at the value ticks: ink at 7 % (light), 8 % (dark).
grid-majorrgba(20, 22, 27, 0.14)rgba(236, 238, 242, 0.16)The major line of a grid whose minor lines are grid: the mm grid's line each five millimetres, under a waveform at a physical scale (its line each millimetre is grid); a log axis's decade, where 2 to 9 are grid; the Smith chart's unity circle and ±1 arcs: ink at 14 % (light), 16 % (dark). DESIGN-SCIENCE §4.5, §14.
base#939496#626468The baseline and the zero line, 1 px: ink over card at the least share that stands 3:1.
ink#14161b#eceef2Titles, the headline figure, values, chip words, on card and page (18.1:1 light, 15.5:1 dark on card). The focus ring.
ink-tint#dededf#333539The ground of a site's icon tiles and hero in the house: ink at 14 % over card. ink stands 3:1 on it; no word stands on it.
muted#5f6570#a0a6b0Labels, ticks, context, notes, on card (5.86:1 light, 7.33:1 dark) and page.
faint#8f95a0#6c727dMarks only, never words: a hidden series' dot, a disabled control (3.01:1 light, 3.71:1 dark on card).
chiprgba(20, 22, 27, 0.05)rgba(236, 238, 242, 0.06)Behind a chip's words: ink at 5 % (light), 6 % (dark).
muted-on-ink#5f6570#787e88muted where a picture draws it on ink or under it, on every shape of it in that picture: its light-ground value moved in lightness until it stands 3:1 on ink and on ink-tint (DESIGN-PICTURES-DARK §2). The light ground's is muted itself.
band · 3
band
TokenLightDarkUsage
band-1rgba(20, 22, 27, 0.05)rgba(236, 238, 242, 0.06)A bullet's first band (poor), behind its measure: ink at 5 % (light), 6 % (dark).
band-2rgba(20, 22, 27, 0.1)rgba(236, 238, 242, 0.12)A bullet's second band (fair): ink at 10 % (light), 12 % (dark).
band-3rgba(20, 22, 27, 0.15)rgba(236, 238, 242, 0.18)A bullet's third band (good): ink at 15 % (light), 18 % (dark).
series-of-4 · 4
series-of-4
TokenLightDarkUsage
series-1-of-4#8649e1#ad92ecSeries 1 in a chart of one to four series: the kernel's seat 1 on the ring of 4 from seed, at lightness 0.56 light, 0.72 dark (the default look). Drawn by the library; never typed, never reordered.
series-2-of-4#368754#4fbe78Series 2 in a chart of one to four series: the kernel's seat 2 on the ring of 4 from seed, at lightness 0.56 light, 0.72 dark (the default look). Drawn by the library; never typed, never reordered.
series-3-of-4#c43a5f#ee7c92Series 3 in a chart of one to four series: the kernel's seat 3 on the ring of 4 from seed, at lightness 0.56 light, 0.72 dark (the default look). Drawn by the library; never typed, never reordered.
series-4-of-4#8f6f30#ca9c47Series 4 in a chart of one to four series: the kernel's seat 4 on the ring of 4 from seed, at lightness 0.56 light, 0.72 dark (the default look). Drawn by the library; never typed, never reordered.
series-of-4-edge · 4
series-of-4-edge
TokenLightDarkUsage
series-1-of-4-edge#a686ea#c4b3f1The lit edge of series 1 of the ring of 4, 1.5 px along a filled mark's value end: its ink lit by the light law (lit, structure) at EDGE_LIGHT 0.35. A stacked area's layer fills in it, its line in the series ink.
series-2-of-4-edge#4ab471#5ddc8cThe lit edge of series 2 of the ring of 4, 1.5 px along a filled mark's value end: its ink lit by the light law (lit, structure) at EDGE_LIGHT 0.35. A stacked area's layer fills in it, its line in the series ink.
series-3-of-4-edge#ec6b86#f2a6b2The lit edge of series 3 of the ring of 4, 1.5 px along a filled mark's value end: its ink lit by the light law (lit, structure) at EDGE_LIGHT 0.35. A stacked area's layer fills in it, its line in the series ink.
series-4-of-4-edge#be9443#e9b553The lit edge of series 4 of the ring of 4, 1.5 px along a filled mark's value end: its ink lit by the light law (lit, structure) at EDGE_LIGHT 0.35. A stacked area's layer fills in it, its line in the series ink.
series-of-4-text · 4
series-of-4-text
TokenLightDarkUsage
series-1-of-4-text#8649e1#ad92ecThe words of series 1 of the ring of 4 on the card: its name at its end, a value in its colour. The series ink where it stands 4.5:1 on card, else that ink moved in lightness until it does (atLightness).
series-2-of-4-text#358553#4fbe78The words of series 2 of the ring of 4 on the card: its name at its end, a value in its colour. The series ink where it stands 4.5:1 on card, else that ink moved in lightness until it does (atLightness).
series-3-of-4-text#c43a5f#ee7c92The words of series 3 of the ring of 4 on the card: its name at its end, a value in its colour. The series ink where it stands 4.5:1 on card, else that ink moved in lightness until it does (atLightness).
series-4-of-4-text#8f6f30#ca9c47The words of series 4 of the ring of 4 on the card: its name at its end, a value in its colour. The series ink where it stands 4.5:1 on card, else that ink moved in lightness until it does (atLightness).
series-of-4-tint · 4
series-of-4-tint
TokenLightDarkUsage
series-1-of-4-tint#eee6fb#2a2838The ground of a site's icon tiles and hero in the zone on seat 1: series-1-of-4 at 14 % over card. Its seat stands 3:1 on it; no word stands on it.
series-2-of-4-tint#e3eee7#1d2e28The ground of a site's icon tiles and hero in the zone on seat 2: series-2-of-4 at 14 % over card. Its seat stands 3:1 on it; no word stands on it.
series-3-of-4-tint#f7e3e9#33252cThe ground of a site's icon tiles and hero in the zone on seat 3: series-3-of-4 at 14 % over card. Its seat stands 3:1 on it; no word stands on it.
series-4-of-4-tint#efebe2#2e2a21The ground of a site's icon tiles and hero in the zone on seat 4: series-4-of-4 at 14 % over card. Its seat stands 3:1 on it; no word stands on it.
series-of-4-on-ink · 2
series-of-4-on-ink
TokenLightDarkUsage
series-1-of-4-on-ink#8649e1#8b54e2Seat 1 where a picture draws it on ink or under it, on every shape of it in that picture and with its edge's step: its light-ground value moved in lightness until it stands 3:1 on ink and on its tint (DESIGN-PICTURES-DARK §2).
series-3-of-4-on-ink#c43a5f#cb3c63Seat 3 where a picture draws it on ink or under it, on every shape of it in that picture and with its edge's step: its light-ground value moved in lightness until it stands 3:1 on ink and on its tint (DESIGN-PICTURES-DARK §2).
series-of-4-edge-on-ink · 2
series-of-4-edge-on-ink
TokenLightDarkUsage
series-1-of-4-edge-on-ink#a686ea#9b73e7Seat 1's edge where a picture draws it on ink or under it, on every shape of it in that picture and with its seat's step: its light-ground value moved in lightness until it stands 3:1 on ink (DESIGN-PICTURES-DARK §2).
series-3-of-4-edge-on-ink#ec6b86#ea5076Seat 3's edge where a picture draws it on ink or under it, on every shape of it in that picture and with its seat's step: its light-ground value moved in lightness until it stands 3:1 on ink (DESIGN-PICTURES-DARK §2).
series-of-6 · 6
series-of-6
TokenLightDarkUsage
series-1-of-6#8649e1#ad92ecSeries 1 in a chart of five or six series: the kernel's seat 1 on the ring of 6 from seed, at lightness 0.56 light, 0.72 dark (the default look). Drawn by the library; never typed, never reordered.
series-2-of-6#368281#4fb7b6Series 2 in a chart of five or six series: the kernel's seat 2 on the ring of 6 from seed, at lightness 0.56 light, 0.72 dark (the default look). Drawn by the library; never typed, never reordered.
series-3-of-6#bc3986#ee74b6Series 3 in a chart of five or six series: the kernel's seat 3 on the ring of 6 from seed, at lightness 0.56 light, 0.72 dark (the default look). Drawn by the library; never typed, never reordered.
series-4-of-6#368933#4fc14bSeries 4 in a chart of five or six series: the kernel's seat 4 on the ring of 6 from seed, at lightness 0.56 light, 0.72 dark (the default look). Drawn by the library; never typed, never reordered.
series-5-of-6#b5532f#ed835eSeries 5 in a chart of five or six series: the kernel's seat 5 on the ring of 6 from seed, at lightness 0.56 light, 0.72 dark (the default look). Drawn by the library; never typed, never reordered.
series-6-of-6#887230#bfa247Series 6 in a chart of five or six series: the kernel's seat 6 on the ring of 6 from seed, at lightness 0.56 light, 0.72 dark (the default look). Drawn by the library; never typed, never reordered.
series-of-6-edge · 6
series-of-6-edge
TokenLightDarkUsage
series-1-of-6-edge#a686ea#c4b3f1The lit edge of series 1 of the ring of 6, 1.5 px along a filled mark's value end: its ink lit by the light law (lit, structure) at EDGE_LIGHT 0.35. A stacked area's layer fills in it, its line in the series ink.
series-2-of-6-edge#4aadac#5dd4d3The lit edge of series 2 of the ring of 6, 1.5 px along a filled mark's value end: its ink lit by the light law (lit, structure) at EDGE_LIGHT 0.35. A stacked area's layer fills in it, its line in the series ink.
series-3-of-6-edge#ec60af#f2a2caThe lit edge of series 3 of the ring of 6, 1.5 px along a filled mark's value end: its ink lit by the light law (lit, structure) at EDGE_LIGHT 0.35. A stacked area's layer fills in it, its line in the series ink.
series-4-of-6-edge#4ab646#5cdf57The lit edge of series 4 of the ring of 6, 1.5 px along a filled mark's value end: its ink lit by the light law (lit, structure) at EDGE_LIGHT 0.35. A stacked area's layer fills in it, its line in the series ink.
series-5-of-6-edge#ec7348#f2ab92The lit edge of series 5 of the ring of 6, 1.5 px along a filled mark's value end: its ink lit by the light law (lit, structure) at EDGE_LIGHT 0.35. A stacked area's layer fills in it, its line in the series ink.
series-6-of-6-edge#b49943#ddbb54The lit edge of series 6 of the ring of 6, 1.5 px along a filled mark's value end: its ink lit by the light law (lit, structure) at EDGE_LIGHT 0.35. A stacked area's layer fills in it, its line in the series ink.
series-of-6-text · 6
series-of-6-text
TokenLightDarkUsage
series-1-of-6-text#8649e1#ad92ecThe words of series 1 of the ring of 6 on the card: its name at its end, a value in its colour. The series ink where it stands 4.5:1 on card, else that ink moved in lightness until it does (atLightness).
series-2-of-6-text#358180#4fb7b6The words of series 2 of the ring of 6 on the card: its name at its end, a value in its colour. The series ink where it stands 4.5:1 on card, else that ink moved in lightness until it does (atLightness).
series-3-of-6-text#bc3986#ee74b6The words of series 3 of the ring of 6 on the card: its name at its end, a value in its colour. The series ink where it stands 4.5:1 on card, else that ink moved in lightness until it does (atLightness).
series-4-of-6-text#358732#4fc14bThe words of series 4 of the ring of 6 on the card: its name at its end, a value in its colour. The series ink where it stands 4.5:1 on card, else that ink moved in lightness until it does (atLightness).
series-5-of-6-text#b5532f#ed835eThe words of series 5 of the ring of 6 on the card: its name at its end, a value in its colour. The series ink where it stands 4.5:1 on card, else that ink moved in lightness until it does (atLightness).
series-6-of-6-text#887230#bfa247The words of series 6 of the ring of 6 on the card: its name at its end, a value in its colour. The series ink where it stands 4.5:1 on card, else that ink moved in lightness until it does (atLightness).
series-of-8 · 8
series-of-8
TokenLightDarkUsage
series-1-of-8#8649e1#ad92ecSeries 1 in a chart of seven or eight series: the kernel's seat 1 on the ring of 8 from seed, at lightness 0.56 light, 0.72 dark (the default look). Drawn by the library; never typed, never reordered.
series-2-of-8#358092#4eb4cdSeries 2 in a chart of seven or eight series: the kernel's seat 2 on the ring of 8 from seed, at lightness 0.56 light, 0.72 dark (the default look). Drawn by the library; never typed, never reordered.
series-3-of-8#b63a9c#ee6cd0Series 3 in a chart of seven or eight series: the kernel's seat 3 on the ring of 8 from seed, at lightness 0.56 light, 0.72 dark (the default look). Drawn by the library; never typed, never reordered.
series-4-of-8#368474#4fbaa3Series 4 in a chart of seven or eight series: the kernel's seat 4 on the ring of 8 from seed, at lightness 0.56 light, 0.72 dark (the default look). Drawn by the library; never typed, never reordered.
series-5-of-8#c63b4e#ee7e85Series 5 in a chart of seven or eight series: the kernel's seat 5 on the ring of 8 from seed, at lightness 0.56 light, 0.72 dark (the default look). Drawn by the library; never typed, never reordered.
series-6-of-8#4c8631#6dbc48Series 6 in a chart of seven or eight series: the kernel's seat 6 on the ring of 8 from seed, at lightness 0.56 light, 0.72 dark (the default look). Drawn by the library; never typed, never reordered.
series-7-of-8#a26330#e48d46Series 7 in a chart of seven or eight series: the kernel's seat 7 on the ring of 8 from seed, at lightness 0.56 light, 0.72 dark (the default look). Drawn by the library; never typed, never reordered.
series-8-of-8#837430#b9a547Series 8 in a chart of seven or eight series: the kernel's seat 8 on the ring of 8 from seed, at lightness 0.56 light, 0.72 dark (the default look). Drawn by the library; never typed, never reordered.
series-of-8-edge · 8
series-of-8-edge
TokenLightDarkUsage
series-1-of-8-edge#a686ea#c4b3f1The lit edge of series 1 of the ring of 8, 1.5 px along a filled mark's value end: its ink lit by the light law (lit, structure) at EDGE_LIGHT 0.35. A stacked area's layer fills in it, its line in the series ink.
series-2-of-8-edge#4aaac2#5cd0edThe lit edge of series 2 of the ring of 8, 1.5 px along a filled mark's value end: its ink lit by the light law (lit, structure) at EDGE_LIGHT 0.35. A stacked area's layer fills in it, its line in the series ink.
series-3-of-8-edge#ec55cd#f29fdcThe lit edge of series 3 of the ring of 8, 1.5 px along a filled mark's value end: its ink lit by the light law (lit, structure) at EDGE_LIGHT 0.35. A stacked area's layer fills in it, its line in the series ink.
series-4-of-8-edge#4baf9a#5dd7bdThe lit edge of series 4 of the ring of 8, 1.5 px along a filled mark's value end: its ink lit by the light law (lit, structure) at EDGE_LIGHT 0.35. A stacked area's layer fills in it, its line in the series ink.
series-5-of-8-edge#ec6d78#f2a8aaThe lit edge of series 5 of the ring of 8, 1.5 px along a filled mark's value end: its ink lit by the light law (lit, structure) at EDGE_LIGHT 0.35. A stacked area's layer fills in it, its line in the series ink.
series-6-of-8-edge#67b244#7fda55The lit edge of series 6 of the ring of 8, 1.5 px along a filled mark's value end: its ink lit by the light law (lit, structure) at EDGE_LIGHT 0.35. A stacked area's layer fills in it, its line in the series ink.
series-7-of-8-edge#d78542#f2ad7bThe lit edge of series 7 of the ring of 8, 1.5 px along a filled mark's value end: its ink lit by the light law (lit, structure) at EDGE_LIGHT 0.35. A stacked area's layer fills in it, its line in the series ink.
series-8-of-8-edge#af9b43#d6bf54The lit edge of series 8 of the ring of 8, 1.5 px along a filled mark's value end: its ink lit by the light law (lit, structure) at EDGE_LIGHT 0.35. A stacked area's layer fills in it, its line in the series ink.
series-of-8-text · 8
series-of-8-text
TokenLightDarkUsage
series-1-of-8-text#8649e1#ad92ecThe words of series 1 of the ring of 8 on the card: its name at its end, a value in its colour. The series ink where it stands 4.5:1 on card, else that ink moved in lightness until it does (atLightness).
series-2-of-8-text#358092#4eb4cdThe words of series 2 of the ring of 8 on the card: its name at its end, a value in its colour. The series ink where it stands 4.5:1 on card, else that ink moved in lightness until it does (atLightness).
series-3-of-8-text#b63a9c#ee6cd0The words of series 3 of the ring of 8 on the card: its name at its end, a value in its colour. The series ink where it stands 4.5:1 on card, else that ink moved in lightness until it does (atLightness).
series-4-of-8-text#358273#4fbaa3The words of series 4 of the ring of 8 on the card: its name at its end, a value in its colour. The series ink where it stands 4.5:1 on card, else that ink moved in lightness until it does (atLightness).
series-5-of-8-text#c63b4e#ee7e85The words of series 5 of the ring of 8 on the card: its name at its end, a value in its colour. The series ink where it stands 4.5:1 on card, else that ink moved in lightness until it does (atLightness).
series-6-of-8-text#4b8430#6dbc48The words of series 6 of the ring of 8 on the card: its name at its end, a value in its colour. The series ink where it stands 4.5:1 on card, else that ink moved in lightness until it does (atLightness).
series-7-of-8-text#a26330#e48d46The words of series 7 of the ring of 8 on the card: its name at its end, a value in its colour. The series ink where it stands 4.5:1 on card, else that ink moved in lightness until it does (atLightness).
series-8-of-8-text#837430#b9a547The words of series 8 of the ring of 8 on the card: its name at its end, a value in its colour. The series ink where it stands 4.5:1 on card, else that ink moved in lightness until it does (atLightness).
rise · 3
rise
TokenLightDarkUsage
rise#36893d#4fc059Up, only where a mark means up: a delta chip, a rising candle, a waterfall's increase. The cycle's 145° at the series lightness.
rise-tint#e3eee4#1d2f24Behind a rising delta chip's words: rise at 14 % over card.
rise-text#2e7835#4fc059A rising delta chip's words on rise-tint, solved to 4.5:1.
fall · 3
fall
TokenLightDarkUsage
fall#c73b3b#ee8079Down, only where a mark means down: a delta chip, a falling candle, a waterfall's decrease. The cycle's 25° at the series lightness.
fall-tint#f7e4e4#332628Behind a falling delta chip's words: fall at 14 % over card.
fall-text#be3838#ee8079A falling delta chip's words on fall-tint, solved to 4.5:1.
seq · 5
seq
TokenLightDarkUsage
seq-1#e0d9f8#110426The sequential scale, step 1 of 5 (value 0): the seed's hue at the kernel's lightness for the value (valueLightness), from near the ground to far from it. A heatmap's cells, a calendar's days. Words on it take whichever of ink and card stands further from it.
seq-2#b096ec#421d77The sequential scale, step 2 of 5 (value 0.25): the seed's hue at the kernel's lightness for the value (valueLightness), from near the ground to far from it. A heatmap's cells, a calendar's days. Words on it take whichever of ink and card stands further from it.
seq-3#8649e1#7b3bd4The sequential scale, step 3 of 5 (value 0.5): the seed's hue at the kernel's lightness for the value (valueLightness), from near the ground to far from it. A heatmap's cells, a calendar's days. Words on it take whichever of ink and card stands further from it.
seq-4#512590#a88aeaThe sequential scale, step 4 of 5 (value 0.75): the seed's hue at the kernel's lightness for the value (valueLightness), from near the ground to far from it. A heatmap's cells, a calendar's days. Words on it take whichever of ink and card stands further from it.
seq-5#210b3f#dbd1f6The sequential scale, step 5 of 5 (value 1): the seed's hue at the kernel's lightness for the value (valueLightness), from near the ground to far from it. A heatmap's cells, a calendar's days. Words on it take whichever of ink and card stands further from it.
count · 5
count
TokenLightDarkUsage
count-1#8649e1#8649e1A density's cell counted once (persistence, the eye diagram): the seed's sequential hue from seq-3 away from the ground until it stands 3:1 on card and on chip over the card, since a cell with any count is a mark. DESIGN-SCIENCE §4.8.
count-2#6c33bc#9971e6A density's cell counted 2 to 9 times: a quarter of the way from count-1 to count-5 in OKLCH lightness, on the seed's sequential hue.
count-3#522590#ae92ecA density's cell counted 10 to 99 times: half the way from count-1 to count-5 in OKLCH lightness.
count-4#391767#c4b2f1A density's cell counted 100 to 999 times: three quarters of the way from count-1 to count-5 in OKLCH lightness.
count-5#210b3f#dbd1f6A density's cell counted 1,000 times or more (the top decade an option raises): seq-5.
div · 5
div
TokenLightDarkUsage
div-1#200b40#dad1f6The diverging scale, step 1 of 5 (value −1): the cool side of the theme's diverging pair, a purple or a blue, at the kernel's lightness for the value, furthest from the ground (diverging). A measure with a natural middle: a seismic section's negative amplitude.
div-2#844be1#793bd6The diverging scale, step 2 of 5 (value −0.5): the cool side at the kernel's lightness for the value (diverging).
div-3#ffffff#15171bThe diverging scale, step 3 of 5 (value 0): the middle, the card (diverging).
div-4#c63e2f#b33829The diverging scale, step 4 of 5 (value 0.5): the warm side, a red-orange, at the kernel's lightness for the value (diverging).
div-5#340a06#f7ccc4The diverging scale, step 5 of 5 (value 1): the warm side, a red-orange, furthest from the ground (diverging). A measure with a natural middle: a seismic section's positive amplitude.

Type

One face, Inter, measured by its own widths.

Every number in tabular figures; nothing set in a monospace or in upper case.
Card
StyleSampleMeasureUsage
headline£1,284k26px/1.1 700, -0.02emThe card's figure, tabular figures, in ink.
headline-narrow£1,284k22px/1.1 700, -0.02emThe card's figure below 400 px.
titleSales by region15px/1.3 600The card's title: sentence case, one line, in ink.
contextUnits, by quarter12.5px/1.4 400The host's subtitle, the unit and the period, one line, in muted.
Chart
StyleSampleMeasureUsage
labelQ1 Q2 Q3 Q411.5px/1.3 500Ticks and axis words, in muted.
valueRevenue 61212px/1.3 600A series' end label in its own ink, a value on a mark, the tooltip's figures, the delta chip.
chip-textNorth12px/1 500A chip's words, in ink; muted when its series is hidden.
noteSource: company accounts11px/1.3 400The chart's own notes, the source line, the mark row, in muted.
Clock
StyleSampleMeasureUsage
display-small14:0340px/1 600, -0.02emA digital clock's or a timer's figures at the least display step, in ink: the view takes the largest step its room gives.
display14:0364px/1 600, -0.02emA digital clock's or a timer's figures at the middle display step, in ink.
display-large14:0396px/1 600, -0.02emA digital clock's or a timer's figures at the largest display step, in ink.

Measures

Every measure, drawn.
Spacing, radius, shadow, stroke, size, opacity, duration and easing. Open one to see each token drawn.
Spacing · 14

Spacing
TokenShownValueUsage
space-card
18px
The card's padding.
space-card-narrow
14px
The card's padding below 400 px.
space-header
10px
Header to plot; plot to the key and chips.
space-chip
6px
Chip to chip; a chip's padding top and bottom.
space-chip-x
12px
A chip's padding at its end.
space-chip-start
10px
A chip's padding at its dot's side; a key item's dot stands there too, with no pill behind it.
space-tick
8px
A tick word from the plot.
space-foot
8px
Between the lines of the foot: what stands over the said strip and it, the said strip and the caption, the foot's last line and the mark row's credit.
space-label
14px
The least between two end labels; names pushed apart to it.
space-part
2px
Between parts that touch and between a group's bars: the card shows through.
space-axis-title
18px
An axis title's band, beside the value column or under the category row, when a title is given.
space-group
12px
Between groups of a strip chart's rows that stand together (an EEG's chains). DESIGN-SCIENCE §4.4.
space-pane
18px
Between panes of one picture, beside the next pane's name row and, where the two x differ, the pane above's tick row. DESIGN-SCIENCE §4.6.
space-erase
16px
The gap ahead of the pen where a live waveform overwrites its last pass, as a monitor draws. DESIGN-SCIENCE §4.9.

Radius · 8

Radius
TokenShownValueUsage
radius-card
16px
The card.
radius-tooltip
10px
The tooltip card.
radius-bar
5px
A column's or bar's value end, at most half its width; the baseline end square.
radius-tile
6px
A treemap's tile.
radius-cell
4px
A heatmap's cell, a calendar's day, the scale key's ramp.
radius-key-mark
3px
A key item's square mark: its corners.
radius-chip
999px
Chips and delta chips: pills.
radius-icon-tile
8px
A site's icon tile, small and large (README, Sites on Hue).

Shadow · 2

Shadow
TokenShownValueUsage
shadow-card
0 1px 2px rgba(18, 22, 32, 0.05), 0 8px 24px rgba(18, 22, 32, 0.06) light
0 1px 2px rgba(0, 0, 0, 0.4), 0 8px 24px rgba(0, 0, 0, 0.35) dark
The card, where card is on; none where it is off.
shadow-tooltip
0 2px 4px rgba(18, 22, 32, 0.08), 0 12px 32px rgba(18, 22, 32, 0.14) light
0 2px 4px rgba(0, 0, 0, 0.5), 0 12px 32px rgba(0, 0, 0, 0.5) dark
The tooltip card, raised above the card.

Stroke · 9

Line weights.

Stroke
TokenShownValueUsage
stroke-line
2.25px
A series' line; round joins and caps.
stroke-signal
1.25px
A waveform drawn at four samples or more a pixel column (a strip chart's row, a capture, a lead); fewer keep stroke-line. DESIGN-SCIENCE §4.14.
stroke-edge
1.5px
The lit edge along a filled mark's value end; a line drawn beneath a series' line, thinner than it (the period before's), and the ring round a period to date.
stroke-hollow
1.5px
A hollow candle's outline: the body of a candle that closed up.
stroke-point-ring
2px
The ring of card round a line's point (its last, and any shown on hover or focus), so it stands clear of the line and the grid.
stroke-scatter-ring
1px
The ring of card round a scatter point, so points that crowd stay one apiece.
stroke-hairline
1px
Grid, baseline, card outline, a moved label's leader, the crosshair, a candle's wick.
stroke-focus
2px
The focus ring, in ink, 2 px off the mark.
stroke-zone-bar
3px
The bar that leads a site's kicker and footer heading, in its zone's ink: its height.

Size · 30

Mark sizes and shares.

Size
TokenShownValueUsage
size-point
3.5px
A line's last point, ringed 2 px in card.
size-scatter
4px
A scatter point, ringed 1 px in card.
size-chip
28px
A chip's and a delta chip's height: above WCAG 2.2's 24 px target.
size-chip-dot
8px
A chip's dot.
size-candle-body
6px
The least a candle's body is drawn, four of its hollow's strokes, about the middle of its open and close: so the hollow always shows.
size-band
70%
A category's bars fill this share of its band, and a lane's bars of its lane: a column, a bar, a pyramid's side, a waterfall's step, a candle's day, a status or Gantt lane.
size-band-box
55%
A box plot's box fills this share of its group's band.
size-band-bullet
65%
A bullet's row: its bands, its measure and its target fill this share of it.
size-band-funnel
88%
A funnel's stage fills this share of its row by default; its gap option sets the rest.
size-band-timeline
80%
A timeline's group fills this share of its lane; an event's bar is half of it, at most 18 px.
size-hole
62%
A donut's hole, of its radius.
size-key-ramp
160px
The scale key's ramp, 8 px tall.
size-handle
24px
A handle: a navigator's, a cursor's, a caliper's end; its height, WCAG 2.2's least target; a quarter of it wide, its ends round, in base.
size-row
30px
The least height of a strip chart's row, and at least 10 mm at a physical scale. DESIGN-SCIENCE §4.4.
size-count-cell
2px
A density's cell in persistence and the eye diagram, each way. DESIGN-SCIENCE §4.8.
size-hit
5px
How far a datum's region reaches past its mark each way, so a pointer finds a thin line or a small point.
size-class-strip
36px
A class legend's strip: its label above, its swatches, its edges' words below.
size-gutter-most
240px
The most the end gutter takes, whatever the canvas: past it the names at the marks wrap.
size-key-mark
10px
A key item's mark: a square this wide, its corners radius-key-mark; a tick this tall.
size-month-band
27px
A calendar page's month band at its head: the month and year centred in title.
size-weekday-row
18px
A calendar page's weekday row under its month band: the seven names over their columns.
size-week-column
24px
The week column down a calendar's left side, where week numbers are asked.
size-day-least
24px
The least a calendar's day cell stands wide: a second page stands beside a page only where seven such cells fit.
size-day-ring
22px
The ring round today's number on a calendar: its diameter.
size-day-bar
3px
The bar along a calendar day's foot: its height.
size-icon-small
18px
A site's icon in an eyebrow or a menu item, on a size-icon-tile-small tile.
size-icon
28px
A site's icon on a Card's or a Strip item's size-icon-tile tile.
size-icon-tile-small
32px
The tile under an eyebrow's or a menu item's icon, in its zone's tint.
size-icon-tile
48px
The tile under a Card's or a Strip item's icon, in its zone's tint.
size-zone-bar
16px
The bar that leads a site's kicker and footer heading, in its zone's ink: its length.

Opacity · 3

Shares of an ink.

Opacity
TokenShownValueUsage
opacity-area
0.3
An area's fill at its line, fading to none at the base.
opacity-dim
0.35
The other series while one is hovered or focused.
opacity-pressed
0.12
ink behind a chip or a name while pressed: the state layer.

Duration · 3

Motion, the element's and Power BI's; a file is the last frame; none under reduced motion.

Duration
TokenShownValueUsage
duration-enter
600ms
Marks grow from the baseline, lines draw, a donut sweeps.
duration-morph
300ms
A change of data.
duration-stagger
20ms
Between categories on entering, at most 200 ms in all.

Easing · 2

Easing
TokenShownValueUsage
easing-enter
cubic-bezier(0.05, 0.7, 0.1, 1)
Entering: Material 3's emphasized decelerate.
easing-morph
cubic-bezier(0.2, 0, 0, 1)
A change of data: Material 3's standard.

Components

Every component, with its guidelines.

Each drawn by the library where a still picture can show it: a chart, or the part of one it names.

Distribution

Antenna radiation pattern: the antenna polar chart, drawn by Hue Charts from its own sample.

AntennaPolar

An antenna's gain round it in dBi, the E-plane and the H-plane, with the half-power beam and the back

Guidelines

An antenna polar draws an antenna's gain round it as a closed line on a polar grid, a line for each plane cut, so where it radiates, how narrowly, and how much leaks behind it stand in one picture.

  • Provide: the cuts, each its name (E-plane, H-plane) and its gain in dBi at each angle, from −180° to 180° with 0° at the boresight, a degree apart or as the host gives them; and the frequency the cuts are at, said in the context line. The cuts stand on one scale: none is normalised to its own peak.
  • Cuts: each a closed line in its series-k-of-m at stroke-line, round joins, its radius from the centre the gain's place between the floor and the outer ring, linear in dB. Each is named by a hairline in its ink out to the right of the angles, the name in value in its series-k-of-m-text, led from the angle where the cuts stand furthest apart, the names in the order their leaders leave the cuts so none crosses another.
  • The grid: rings each 10 dB in grid, four of them, the outer a round value above the peak (10 dBi) in base and the floor at the centre (−30 dBi); a spoke each 30° through the centre in grid. The rings' values stand up the boresight just inside each ring, to the right of the spoke, in label with their unit ("0 dBi", "−10 dBi"), where the main lobe leaves room and no cut passes; the outer ring's stands outside it beside the 0°. The angles stand outside the outer ring in label, signed, clockwise from the boresight ("−30°", "180°"). A gain below the floor is drawn at the centre.
  • Half power: a dashed hairline in ink at the peak less 10 log₁₀ 2 = 3.0103 dB, named "−3 dB" on a plate of card at its foot. Where each cut crosses it stands a disc of size-point in the cut's ink, ringed in card: the beam's two edges.
  • The peak: a disc of size-scatter in ink at the greatest gain, its value in value in ink inside the half-power ring, to the left of the spoke ("7.5 dBi").
  • Axes: the radius is gain in dBi, linear in dB (never field or power), the angle in degrees round the antenna.
  • Measurements: the peak gain; each cut's −3 dB beamwidth, the angle between the two places either side of its peak where it falls through the peak less 3.0103 dB, each on the straight line between two samples, walked outward from the peak each way round the cut; and each cut's front-to-back ratio, the peak less the gain half a turn from it, in dB.
  • Options: topRing (the outer ring's dBi), ringStep (dB a ring), rings, angles (signed, or 0° to 360°), zeroAngle (the angle at the top), direction (clockwise or anticlockwise), halfPower (the half-power ring, on), normalise (each cut to its own peak, off).
  • Don't: fill a cut, or give each cut a scale of its own: a fill hides the cut behind it where the planes overlap, and two scales make the planes' gains unreadable against each other.
Scores by ward: the box plot chart, drawn by Hue Charts from its own sample.

BoxPlot

Quartiles, the median, whiskers and the points beyond them

Guidelines

A box plot compares how values are spread across groups: the middle half, the median, the reach and what lies beyond.

  • Provide: the values of each group, or each group's quartiles, whisker ends and outlying values.
  • Marks: the box from the first quartile to the third in series-1-of-4, rounded radius-cell; the median a band of card across it at stroke-line, so it reads without its colour; whiskers and their caps at stroke-edge to the furthest values within 1.5 box-lengths; values beyond as points, size-scatter, filled in the ink and ringed 1 px in card as the Scatter's, so each series' points take its marker where series are told by pattern.
  • Notes: say what the box and the whiskers are, since readers differ on it.
  • Don't: colour the groups as series when they are categories of one measure, or hide the outlying points.
10 Gb/s link: the eye diagram chart, drawn by Hue Charts from its own sample.

EyeDiagram

A link's bits folded onto two unit intervals, its eye open inside its mask

Guidelines

An eye diagram folds a serial link's waveform at its clock onto two unit intervals, each fold counted where it crosses, so the eye's opening shows: persistence's preset.

  • Provide: one waveform, held; its clock's edges in seconds, rising, or a unit interval and its first edge; and a mask where the host tests against one, in unit intervals and the waveform's unit.
  • Folds: each fold is the stretch from half a unit interval before an edge to one and a half after it, −0.5 to 1.5 UI along the foot, counted into the cells as persistence counts an acquisition, in the same five steps and the same key.
  • The mask: regions over the counts in chip, an ink hairline round each, a count inside drawn again over it; its key item, "The mask", is an outline in ink.
  • Measures: at the eye's centre the samples above the record's mean are first taken as the top and those below as the base; the decision level is the midpoint of their means, and a centre above it is a one, below it a zero. The eye's height is the least of the ones less the greatest of the zeros, the opening the picture shows, or the 3σ form where asked. A crossing is where the waveform passes the decision level, placed on the straight line between its two samples, against the clock edge nearest it; the eye's width is the unit interval less the crossings' spread, said in UI and in time.
  • Measurements: the bits folded, the eye's height, its width, and the counts in the mask.
  • Options: eyeHeight (inner, or 3σ), top, and persistence's.
  • Don't: fold at a clock the chart has guessed: it recovers none, so the edges or the unit interval are the host's.
Strength by batch: the histogram chart, drawn by Hue Charts from its own sample.

Histogram

Bins that touch; two batches on one scale, one above the other

Guidelines

A histogram shows how values are spread: how many fall in each bin of a range.

  • Provide: the values, or the counts a bin; the bin's width and unit go in the context.
  • Bins touch: each bar fills its whole bin, space-part from the next with the card between them, its top rounded and lit; the scale starts at zero.
  • Two or more groups stand one above the other on one shared scale, each panel named at its top in its series-k-of-m-text, so a shift between them reads straight down the page. They are never interleaved in one bin.
  • Don't: leave gaps between bins as a column chart does, or choose bins so wide the shape disappears.
Orders by hour: the hour ring chart, drawn by Hue Charts from its own sample.

HourRing

Twenty-four sectors from midnight, each sector's area its count

Guidelines

An hour ring shows when things happen round the day: twenty-four sectors from midnight, each one's area its count.

  • Provide: instants (ISO 8601 text with their time), each counted once or by its weight, which the chart bins by their hour in the zone, as the punch card does; or a row an hour, 0 to 23, with its value. Say the counts' unit.
  • Sectors: one an hour from midnight at the top, clockwise, in series one, square-cornered, space-part apart at the ring's middle, each standing on an inner circle a third of the ring's radius. A sector's outer radius is √(r0² + (R² − r0²) × its count over the largest), r0 the inner circle's radius and R the ring's, so its area beyond the inner circle is its count and sectors are compared by area, as the punch card's dots are. A count above naught reaches at least 0.75 px beyond the circle; a count of naught draws no sector.
  • The circles: the inner circle in base and a faint circle in faint, each a stroke-hairline; the faint one stands at the largest count's reach, the ring's outer edge.
  • The hours: named outside the ring in label, each centred on the angle where its sector begins: every hour where each stands clear of the next, else every sixth, the quarters. "00" to "23" by a 24-hour clock, "9 am" by a 12-hour one.
  • Notes: one line on the picture, how the hours were binned: "binned by the hour by this device's clock (Europe/London)", "binned by the hour in" a zone where one is given, or "the hours as given". That each sector's area is its count and the faint circle the largest, with that count, is carried whole beside the picture, not drawn on it.
  • Options: mark, area or tint: under tint every sector stands whole to the outer edge on seq-1 to seq-5, with the scale's key, and neither circle is drawn. clock, 24-hour or 12-hour. zone, an IANA name, else the device's.
  • Don't: ask the ring for exact values, which are read better in bars: it is for the shape of the day, and its table holds every hour's value. Draw a hand on it: it is a chart of a table, never clocked.
Order book: the bids and asks chart, drawn by Hue Charts from its own sample.

MarketDepth

Bids and asks heaped out from the mid, each side named

Guidelines

Market depth shows the order book: how much is bid and asked at each price, heaped out from the mid.

  • Provide: the bids and the asks, each a list of price levels with their sizes.
  • Marks: each side a step from the mid outward, its line at stroke-line and its fade from opacity-area; bids in series-1-of-4, asks in series-2-of-4. They are two sides of one book, not up and down, so they never take rise and fall.
  • Names: each side named over its inner half in its series-k-of-m-text; the mid a dotted hairline in base, named.
  • Don't: smooth the steps: a level holds until the next price.
Mass spectrum of toluene: the mass spectrum chart, drawn by Hue Charts from its own sample.

MassSpectrum

Relative abundance against m/z as sticks, the base peak at 100 %, the molecular ion marked

Guidelines

A mass spectrum draws a compound's ions as sticks, each at its mass-to-charge ratio and as tall as its share of the most abundant, so the fragments a molecule breaks into read as its fingerprint and the heaviest of its ions as its mass.

  • Provide: the peaks as a list (m/z and abundance, any scale: the chart scales to the base peak), the host's molecular ion where it knows one (its m/z), and the ionisation for the context ("electron ionisation at 70 eV"). The chart assigns no fragment and takes no peak for the molecular ion: the heaviest peak is not assumed to be one.
  • Sticks: each peak a column from the baseline as wide as stroke-line, in series one, its top rounded and lit as every filled mark's value end is. A stick is as tall as its peak, drawn at its true height however short; the foot counts those under a pixel.
  • The base peak: the tallest, at 100 %. The scale is relative, so the axis stands at 0 to 100 % whatever the counts were.
  • The molecular ion: its stick in series two with a point at its tip (size-scatter, ringed in card), named beside the tip "M+" with its m/z, in series-2-of-4-text and value. The name on the mark tells it from the fragments, so colour is not the only cue. Where the host gives none, none is marked.
  • The labels: the top peaks by abundance, six by default, each named by its m/z in label (the base peak in value and ink), centred over its tip. A name that would meet a taller stick or another name stands beside its tip, then higher; a name that finds no room is left out, never drawn over a stick.
  • Axes: relative abundance up, 0 to 100 % at four to six ticks, hairlines in grid and the baseline in base ("20 %"); m/z across, rising left to right as a mass analyser scans, in tens, as bare numbers: m/z is a ratio with no unit, so the context line says it ("Relative abundance in % against m/z") and the ticks do not.
  • Measurements: the base peak's m/z, the molecular ion's m/z and its share, the M+1 peak as a share of M where both stand, and the peaks counted, name in label, value in value.
  • Options: labelled (how many peaks are named), from and to (the m/z view). The molecular ion is the data's, never an option.
  • Don't: scale to anything but the base peak, or name a fragment the host did not assign: the sticks are the host's peaks at their m/z, and the labels are their numbers alone.
Rising edge of a data line: the persistence chart, drawn by Hue Charts from its own sample.

Persistence

Every acquisition overlaid at its trigger, each place inked by how often it was crossed

Guidelines

Persistence overlays every acquisition of a waveform at its trigger, each place inked by how often the waveform crossed it, as an oscilloscope's infinite persistence does.

  • Provide: the acquisitions, each a waveform held whose time naught is its trigger; a mask where the host tests against one, its regions given in the chart's own units; and the host's measures (jitter, rise time).
  • Counts: the plot is cut into cells of size-count-cell each way, and each acquisition marks a cell at most once. At each column of cells the waveform's value at the column's middle, on the straight line between the samples either side, falls in a row, and the acquisition marks every cell from the row it fell in at the column before to the row it falls in now, so a steep edge stands whole. Counts are 32-bit, held at 4,294,967,295 and never wrapped, and the foot says where a cell reaches it. A live feed adds acquisitions to the same grid for as long as it runs.
  • The steps: a cell with any count is a mark, in count-1 (1), count-2 (2 to 9), count-3 (10 to 99), count-4 (100 to 999) or count-5 (1,000 or more), so a single crossing stands 3:1 on card; a cell with no count is the card. The key is five swatches with the first step's count and the last's at its ends ("1", "1,000 or more").
  • Axes: the value axis in the waveforms' unit at four to six ticks, its hairlines in grid under the counts and the zero line in base over them; the time from the trigger along the foot in SI steps ("−1 ns", "0 ns", "1 ns").
  • The mask: regions drawn over the counts in chip with an ink hairline round each; a count inside the mask is drawn again over it, and their sum is a measurement.
  • Measurements: the acquisitions, then the host's measures, then the counts in the mask where there is one.
  • Options: top, the count the darkest step starts at (1,000 by default); a mask, given with the data.
  • Don't: ink a cell by its share of the busiest: the steps go by decades, so a runt among thousands of clean edges still shows.

Change

Visits by source: the area chart, drawn by Hue Charts from its own sample.

Area

The fade, and stacked layers named at their ends

Guidelines

An area chart shows a run of values as the ground under a line, alone with its fade or stacked into a whole.

  • Provide: the categories in order and one or more series; say in the context when they are stacked.
  • One series: the line as a Line draws it, and beneath it the series ink from opacity-area at the line to none at the base.
  • Stacked: each layer fills solid in its series-k-of-m-edge, its top carrying its line in series-k-of-m; each layer is named at its end, at the middle of its last step, in series-k-of-m-text. The scale starts at zero.
  • Options: the baseline at zero, the silhouette or the wiggle (a streamgraph, coloured by layer).
  • Don't: stack series that are not parts of one whole, or fade a stacked layer.
Response of a low-pass filter: the Bode plot chart, drawn by Hue Charts from its own sample.

Bode

Gain in dB and phase in degrees against frequency on a log axis, the −3 dB point and the loop's margins marked

Guidelines

A Bode plot draws a filter's or a loop's gain in dB and its phase in degrees against frequency on a log axis, in two panes that share it, so where the gain falls and where the phase turns read together.

  • Provide: the response at each frequency in Hz, rising: its gain (a ratio, drawn in dB) and its phase in degrees, from a transfer function or a measurement; what it is, a filter or an open loop; and for a filter the passband its −3 dB is taken from, the lowest frequency's gain by default.
  • The panes: the gain 57 % of the room, the phase 43 %, space-pane apart, each named over its pane in value ("Gain, dB", "Phase, degrees"); both share the frequency axis, its words under the phase pane alone. Their curves are each a line at stroke-line in series-1-of-4, one system one ink; a second system (a filter pair, a loop before and after) takes series-2-of-4 in both panes, each named at its end in series-k-of-m-text.
  • Gain: hairlines in grid at round dB steps (20 by default), the 0 dB line in base, words in the lead ("−20 dB"). Decibels are values on a linear scale; the unit says so.
  • Phase: unwrapped, each angle moved by whole turns to stand within half a turn of the one before; hairlines in grid each 90°, words in degrees ("−180°"); a loop's −180° line in base.
  • Axes: frequency across, logarithmic: a hairline in grid-major at each decade and in grid at each of 2 to 9, words at each decade ("100 Hz", "1 kHz") and at 2 and 5 where they stand clear of one another. A frequency at or below naught is refused, naming it.
  • The −3 dB point: where the gain first falls 3.01 dB under the passband's, placed on the straight line between the two samples that straddle it in log frequency; a dashed hairline in ink down through both panes, named over the plot ("−3 dB, 2 kHz"), and a point on each curve (size-point, ringed in card).
  • A loop: the crossover is where the gain first reaches 0 dB, a dashed hairline in ink named over the plot ("0 dB, 126 Hz"); the phase crossover is where the phase first reaches −180°, a dotted one ("−180°, 337 Hz"). The phase margin is the phase at the crossover over −180°, a bar in ink at stroke-focus along the crossover's line in the phase pane from −180° to the curve, its value on a plate of card beside it; the gain margin is the gain at the phase crossover under 0 dB, a bar likewise in the gain pane. Where the gain never reaches 0 dB or the phase never reaches −180°, that margin is not stated and the foot says why.
  • Measurements: a filter: the −3 dB point, the phase there and the passband gain. A loop: the crossover, the phase margin, the phase crossover and the gain margin.
  • The key: for a loop the bar in ink: "A margin".
  • Options: kind (filter or loop), passband, direction (which way the -3 dB point is walked from the passband), drop (another fall than 3.01 dB), gainRange, phaseRange, gainStep.
  • Don't: wrap the phase into ±180°, which draws a jump where the curve is continuous, or read a margin from the curves as drawn: it is read from the data, at the crossover.
HUE / GBP: the candlestick chart, drawn by Hue Charts from its own sample.
A trading day in two seconds

Candlestick

Rise and fall, the last close named at the end

Guidelines

A candlestick chart shows a market's sessions: each candle its open, high, low and close.

  • Provide: the sessions in order, each with its open, high, low and close; volume, studies and compared markets are options.
  • Candles: the wick a hairline from high to low, the body from open to close, in rise where it closed up and fall where it closed down. A candle that closed up is hollow (its outline at stroke-edge) and one that closed down is filled, so the shape says it as well as the ink; the key under the plot says which is which. A body shorter than four times stroke-edge is drawn that tall about the middle of its open and close, so even a session that barely moved shows its hollow; the tooltip gives the open and close exactly.
  • The last close is a dotted hairline across the plot, named at its end in rise-text or fall-text.
  • A compared market is a line in its own dash, in percent from its first close in the view, named at its end and never in the key, which names the one market's marks; where its name finds no clear place it is named in the tooltip and the table.
  • Grid: hairlines at four to six price ticks; the scale fits the range, not zero.
  • Don't: use rise and fall for anything but up and down, or colour the candles as series.
Analgesic tablet by HPLC: the chromatogram chart, drawn by Hue Charts from its own sample.
A ten-minute run in ten seconds

Chromatogram

Detector response against retention time, each peak named, one peak's integrated area shaded

Guidelines

A chromatogram draws a separation's detector response against the time each compound took to leave the column, as an analyst reads one: a peak for each compound, named by it and its retention time, standing on the baseline, and the area under a peak, which is what the compound's amount is read from.

  • Provide: the run as the instrument gives it (the detector's signal in its unit, mAU, pA or mV, at a steady rate over the run, and the time in min), the detector and what it reads ("UV at 254 nm"), and the host's peaks: each its compound, its apex time, and its limits where the host integrated it. The chart names no compound and finds no peak itself: what it says, the host picked. It integrates the peaks the host names, between the limits the host gives and over the baseline the host gives (a straight line between the limits where it gives none).
  • The trace: one waveform in series one, drawn through each pixel column's first, least, greatest and last sample in time order, so a steep flank stays one line, at stroke-signal where a column holds four samples or more and stroke-line where fewer. The run's noise stands as it is: nothing is smoothed.
  • The baseline: the host's baseline across the run, a hairline in base under the trace, so it shows beneath each peak where the trace leaves it. The chart draws no other base line: the value axis's lowest tick is a hairline in grid, since the detector's zero and the baseline are not the same line.
  • The peaks: each named over its apex in value and ink, its retention time under it in label, in min to two places ("5.84 min"). A name that would touch another stands one line higher, joined to its apex by a hairline in base. A peak the host gives no compound for is named by its time alone.
  • The integrated peak: the host asks for it (integrate): the area between the trace and the baseline, from limit to limit, filled flat in series one at opacity-area. It carries no lit edge: the trace is its edge. A peak integrated is shaded, never boxed.
  • Axes: the signal up in its unit at four to six ticks ("200 mAU"), hairlines in grid, space-tick from the plot; retention time across from naught to the run's end in min ("2 min"). The unit stands on every tick, as the data names it.
  • The key: the fill ("Integrated area") and a line in base ("Baseline").
  • Measurements: under the plot, each peak's share of the area (its area over the sum of the named peaks' areas, in %, one place), name in label and value in value; then the integrated peak's area in the signal's unit times min ("119.5 mAU·min"). Where the host's total takes in peaks not named, the share is of that total and the context says so.
  • Options: integrate (the peaks asked integrated shaded, their areas stated), share (each named peak's share of the named areas stated), detector (said in the context line), from and to (the view). The peaks and the baseline are the data's, never options.
  • Don't: shade a peak down to the axis's zero where the baseline stands above it, or name a peak the host did not: the shaded area is the area the % is read from, and it stands on the baseline that was drawn.
Revenue and margin: the combo chart, drawn by Hue Charts from its own sample.

Combo

Columns and a line on two axes, each axis named

Guidelines

A combo chart draws two measures of one run on two axes: columns on the left axis, a line on the right.

  • Provide: the categories, the measure for the columns and the measure for the line, each with its unit.
  • Two axes, one grid: the right axis takes as many ticks as the left, on the same hairlines, so a reader never meets two grids. Each axis is titled with its series' name in that series' series-k-of-m-text, which names the series in words.
  • The line crosses the columns cased in card, space-part clear on either side, as parts that touch are kept apart.
  • Don't: put two measures of the same unit on two axes (draw them on one), or let the axes' zero points differ.
Resting ECG: the ECG chart, drawn by Hue Charts from its own sample.

ECG

Twelve leads on the millimetre grid, each row opening on its calibration pulse

Guidelines

An ECG draws a record's twelve leads on the millimetre grid at a physical scale, as a cardiologist reads them: the strip chart's preset.

  • Provide: the record's leads, held, named I, II, III, aVR, aVL, aVF and V1 to V6 as its recorder labels them, in volts; the host's measures (rate, PR, QRS, QT, QTc, axis); the calipers placed, each its name and its two moments; and the host's marks on a lead, each a moment, with words where it names a wave (P, QRS, T). The chart measures no interval and classes no beat itself: what it says, the host measured.
  • Layouts: three rows of four leads, each a quarter of the record, with lead II along the foot for the whole of it as the rhythm strip (the default); six rows of two; twelve rows; or one lead with its window, where a single beat is read.
  • The mm grid: a line each millimetre in grid and each five in grid-major, under the plot only. Below 2 px a millimetre the millimetre lines drop and the five-millimetre lines stand; below 0.8 px the grid drops, and the foot says so. The speed and the gain, 25 mm/s and 10 mm/mV by default, are said in the context line.
  • Leads: every lead in series one's ink at stroke-signal, each row opening on its calibration pulse: a 1 mV step as tall as the gain makes it and 200 ms wide, in 2 mm more than its width. A lead's name stands at its start inside its row on a plate of card, and a short base mark stands where one lead gives way to the next.
  • The rate: the header's figure is the rate the host gives ("72 bpm"). The measurements row carries the host's measures, then the calipers'.
  • Calipers: one alone on the rhythm strip is a bracket in ink at its handles' height, its interval and rate on a plate of card ("RR 847.0 ms · 71 bpm"), on the bracket where they fit between its grips, else just past its end. Calipers sharing a beat (PR, QRS and QT) each take a lane under the plot, a dashed base guide from each end up to the waveform, the interval beside its end. Each end stands on a handle (size-handle, ends round, in base) and snaps to a host's mark within size-hit.
  • Marks: a host's mark with words names its wave over the lead in label, where the words stand clear of every other.
  • True size: on screen a millimetre is pxPerMm, the host's calibration of its screen, else the view fitted across, and a host with no calibration says beside the picture that it is not at true size; a PDF sets the same drawing at true size, so a millimetre of the grid prints a millimetre.
  • Options: layout, lead (the one laid out alone), speed (5 to 100 mm/s), gain (1 to 40 mm/mV), pxPerMm, cursor and cursorAt, from and to.
  • Don't: say an interval the host did not measure, or draw a lead without its pulse: the pulse is how a reader checks the gain by eye.
Routine EEG: the EEG chart, drawn by Hue Charts from its own sample.

EEG

A record's electrodes in a montage, each chain in its own ink, negative up

Guidelines

An EEG draws a record's electrodes in a montage, each chain of rows in its own ink, as a neurologist reads them: the strip chart's preset.

  • Provide: the record's electrodes, held, each named as its recorder labels it (Fp1, or EEG FP1-REF), in volts at any prefix; its events, each a moment or a span with its words, as EDF+ annotations are decoded; and a host's own montage where it has one: chains of rows, each row two electrodes' names, or one and "Avg".
  • The montage: the double banana by default (the left and right temporal chains, the left and right parasagittal, the midline), else the transverse or the average reference. Each row is one electrode less another, named by its parts ("Fp1–F7"), or less the mean of all the montage's electrodes ("Fp1–Avg"). A row whose electrodes the record does not give is left out, and said.
  • Rows and chains: each chain a group in its series-k-of-m, on the ring of the chains' count (five on the ring of six); its rows stand together, space-group from the next chain's, each named at its start in value in its chain's series-k-of-m-text, and the chain is named in the lead column's outer part at its middle. Each row is at least size-row tall and 10 mm.
  • The physical scale: 30 mm/s and 7 µV/mm by default, negative up, as the clinic reads it. The context line says the clock's span, the speed, the sensitivity and the filters: "14:02:10 to 14:02:20 · 30 mm/s · 7 µV/mm · 1–70 Hz, notch 50 Hz", the record's own prefiltering after them. The foot says "Negative is up.", and the key's bars hold a round value and a second: "100 µV, 1 s on every row".
  • Time: a hairline in grid each second down through the rows, the record's clock time along the foot in label.
  • Events: a flag at the plot's top, its words in value on a plate of card, its line a hairline in ink down through every row. Flags that would touch step down a row; past three rows the said line counts the rest, and the data table holds them.
  • Filters: a high-pass at 1 Hz, a low-pass at 70 Hz and a notch at 50 Hz by default, each a causal second-order section started at rest five of its lowest corner's time constants before the view, so the first second drawn is settled.
  • The overview and the measurements: as the strip chart's: every row's RMS in the column at the end, and the rows and their rate, the samples and the loudest row by its RMS.
  • Options: montage, speed (5 to 120 mm/s), sensitivity (0.5 to 200 µV/mm), highPass, lowPass, notch, polarity, clockTime, pxPerMm, rowsFrom, cursor and cursorAt, from and to. Where a host shows the controls row, it offers the montage, the speed and the sensitivity.
  • Don't: turn an EEG positive up without the foot saying so, or hide a filter: every filter drawn is named in the context line, so a reader never takes a filtered row for the record.
Treated against control: the error bars chart, drawn by Hue Charts from its own sample.

ErrorBars

Means with capped whiskers; each series in its place

Guidelines

An error-bar chart shows a measurement in each category as a point with its error either side, each series in its place.

  • Provide: the categories and, to each series, a label, a value to each category and an error to each value (naught or more). A missing value is a gap, drawn with no point and no whisker and given no error; a series with no errors is refused.
  • Marks: the value is a point in the series ink (size-point, ringed in card); its error is a whisker from the value minus it to the value plus it, stroke-edge wide, capped at both ends, the cap 8 px wide.
  • Places: every series keeps its own place in every category, left to right in the series' order. No name stands at a mark, so chips under the plot name the series in that order and the notes say so: "each series in its own place in every group, in the chips' order".
  • Axes: hairlines in grid at four to six ticks on a value axis that spans the lowest whisker to the highest (from naught where bars are asked), the baseline in base, the category words under their groups.
  • Options: style (point, or bar: beneath each whisker a bar from naught in a tint of the series ink), cap (the cap's width, 0 to 16 px, 8 by default; 0 draws none), values (each value and its error written beside its point, "1.42 ± 0.14"), grid, xAxis, yAxis.
  • Don't: give a gap an error, or name a series at its mark: the place and the chips tell the series apart.
A day's Holter record: the Holter chart, drawn by Hue Charts from its own sample.
A day in a minute

Holter

A day's heart rate and its beats out of place, then one moment at its physical scale

Guidelines

A Holter draws a day of heartbeats and one moment of them: the day's rate above, and the moment's beats at their physical scale below.

  • Provide: each beat's time in seconds from the record's start, rising, and its class as the host gives it (N for a beat in place, by default; VE and SVE for beats out of place); the host's periods (asleep); the record's channels, held, for the moment; the record's clock at its start; and its length.
  • The day: 40 % of the room. The rate in bins, 5 minutes by default, as a band from each bin's least minute rate to its most in series one at opacity-area, with the bin's rate as a line through it at stroke-line; the host's periods as bands in chip behind, each named at its top in label; the value axis in beats a minute, hairlines in grid; the clock along the foot.
  • The lanes: under the day, a lane for each class of beat out of place, a tick in ink for each beat, the class named in the lead in label.
  • The moment: a cursor down through the day and its lanes on a handle (size-handle, ends round, in base), its time beside the handle. Under them, space-pane apart, the moment's pane is named over it ("03:00:00 to 03:00:10 · CH1 and CH2 · 25 mm/s · 10 mm/mV") and drawn at its physical scale: the channels as rows of a strip on the mm grid, each opening on its calibration pulse and named after it, each beat named by its class over the rows (N in label, a beat out of place in value), and each interval in ms under them. Where the moment cannot stand under the day, it is left out and the foot says the height it needs.
  • The figure and the measurements: the header's figure is the beats in the record ("100,333 beats"); the measurements row gives the mean rate, the least and the most minute rate with their minutes, and each class's count.
  • Rates: a beat's interval is its time less the time of the beat before; a minute's rate is the beats in it; a bin's rate is its beats over its minutes, its band its least to its most minute rate; the mean is the beats over the minutes recorded. The chart counts and rates the host's beats and classes none.
  • Options: moment (a share of the record), bin (1 to 60 minutes), speed and gain (the moment's, 25 mm/s and 10 mm/mV by default), pxPerMm.
  • Don't: class a beat the host did not, or draw the moment smaller than it can be read: it stands at its physical scale, or not at all.
Sleep stages overnight: the hypnogram chart, drawn by Hue Charts from its own sample.
A night in a minute

Hypnogram

A night's sleep stages as a stepped line over the clock, REM set apart on its own row

Guidelines

A hypnogram draws a night's sleep stages as a stepped line over the clock, as a sleep scorer draws it, so the night's architecture shows in one line: its cycles of about 90 minutes, where deep sleep stands, REM growing toward the morning, and each waking.

  • Provide: the night as scored, a stage for each 30-second epoch from the record's start, as an EDF+ file's annotations carry them ("Sleep stage N2", an onset and a 30 s duration), or as the host gives them; the clock at the record's start (lights off); and the record's length (lights on). Stages the host names otherwise (W, R, S1 to S4) are read to Wake, REM, N1, N2 and N3 by a mapping the host gives.
  • The rows: one a stage, from the top Wake, REM, N1, N2, N3, as scorers draw them, each a hairline in grid with the baseline in base at N3, named in the lead column in label. REM stands on a row of its own: a band of chip across the night behind it, and its name in value in its series-k-of-m-text.
  • The line: the stages as a stepped line in series one at stroke-line, round joins and caps: each stretch level on its stage's row from its first epoch to the one after its last, the change to the next a vertical step. A stretch of one epoch is a step as wide as the epoch, never dropped, so a brief waking stands as the spike the scorer counted.
  • REM: each stretch of REM drawn again on its row as a bar in series two, a third of a row tall, radius-tile round, with no lit edge. The line's steps stand where the bars begin and end. Bars join across any break narrower than space-part at the drawn width; the line, the table and the measurements keep every break.
  • Time: the clock along the foot in label, a hairline in grid each hour down through the rows, its words at each second hour ("23:00", "01:00"); the context line says the epoch and the span ("scored in 30 s epochs · 23:00 to 07:00").
  • The moments: sleep onset and the first REM, each a flag: a hairline in ink down through the rows from its words on a plate of card over the plot, in value in ink ("Sleep onset 23:12", "First REM 00:28"), one a row so the words do not meet.
  • Axes: the stage up, five categories in the scorers' order; the clock across, the record's start to its end.
  • Measurements: two rows under the plot. The first: total sleep time, the epochs scored as sleep times 30 s; sleep efficiency, total sleep time over the record's length, in %; sleep onset, the first epoch scored as any sleep stage, as a clock time and as minutes into the record; REM latency, from sleep onset to the first epoch of REM; wake after sleep onset (WASO), the wake epochs from sleep onset to sleep offset, the end of the last sleep epoch; and wake after sleep offset (WASF), the wake epochs from there to lights on. The second: each stage's share, its epochs over the record's, in %, the foot saying that the shares are of the time in bed.
  • Options: epoch (30 s by default), sharesOf (the record's epochs or sleep's as the whole), moments (sleep onset and the first REM, or none), timeOfDay (the clock, or the hours from the start). The mapping of the stage names is the data's.
  • Don't: smooth the line, or lay the rows in order of depth with REM among them: the order is the scorers', and a curve invents depths between the stages. Nor drop an epoch that stands alone: it is a waking the report counts.
Revenue and cost: the line chart, drawn by Hue Charts from its own sample.

Line

Straight, named at its end; names pushed apart

Guidelines

A line chart shows how values changed over an ordered run, each series a line named at its end.

  • Provide: the categories in order (months, quarters, dates) and one or more series of values; a unit the data names stands on the ticks, a unit given only in the context line stays off them.
  • Lines: stroke-line, round joins and caps, straight from point to point. curve asks for smooth, a monotone curve that never passes a point, or step. Points are hidden but the last (size-point, ringed in card) and on hover or focus.
  • Names at the ends: each series is named at its end in series-k-of-m-text, in an end gutter as wide as the widest name. Where ends meet, names are pushed space-label apart and joined to their ends by a hairline leader. The names are the series' switches, so a line chart has no chips.
  • Grid: hairlines in grid at four to six ticks, the baseline in base, no axis line, no tick marks. Category words are set every *n*th where they would touch.
  • Don't: smooth through a gap in the data, or name a series anywhere but its end.
Requests by service: the live feed chart, drawn by Hue Charts from its own sample.

LiveFeed

A scrolling window; each latest value beside its name

Guidelines

A live feed shows each series' latest samples as a window that scrolls, each a straight line named at its end.

  • Provide: each series' samples in order, the time of each in seconds or as an instant, or else the seconds between samples (every), and the unit. A feed that gives its times is drawn at them and never stepped; one whose series do not all give theirs is refused.
  • Lines: series-k-of-m, stroke-line wide, straight from sample to sample. The last sample is a point (size-point, ringed in card) with its latest value beside it in value, set only where it stands clear of every word, else left out and counted.
  • Names at the ends: each series is named at its latest sample in series-k-of-m-text, in an end gutter past the latest values. Where ends meet, names are pushed space-label apart and joined to their ends by a hairline leader. The names are the series' switches, so a live feed has no chips.
  • Axes: hairlines in grid at four to six ticks on a value axis that spans the feed's own range with naught in it, the baseline in base. Five times stand under the plot, a hairline at each: "now" at the latest sample and four steps back from it, or, for a feed that gives its times, the seconds from its first sample.
  • The notes: at the plot's top left in note, the feed's reading: "t = 0.0 s · req/s". For a feed given, the time of its last sample, the clock its instants were read by, and each series' longest step against its median, with no gap judged. A window that leaves samples out says so: "last 120 of 300 samples".
  • Options: window (20 to 240 samples, 120 by default), style (line, or area: the series ink from opacity-area at the line to none beneath it), latest (the values beside the line ends, on), grid, and money's writing where the unit is a currency.
  • Don't: step a feed the host gave, or call a long step between samples a gap: the notes say the step and judge none.
Three ethyl compounds: the stacked NMR chart, drawn by Hue Charts from its own sample.

NMRStack

Proton spectra of three samples offset up the card, shift in ppm falling left to right, each multiplet named with its integral

Guidelines

A stacked NMR chart draws the proton spectra of several samples one above another on one chemical-shift axis, each offset up the card, so a reader runs down a shift to see which samples have a multiplet there and which do not, and reads each multiplet's pattern and its integral where it stands.

  • Provide: the samples, bottom to top, each its name and its spectrum (intensity at shifts in ppm, as the instrument's data points, or its lines: shift, width and area), the multiplets the host picked (each its range in ppm, its pattern s, d, t, q, m or br s, its assignment where the host gives one), the spectrometer's frequency in MHz and the solvent. The chart picks no multiplet and assigns none. A multiplet's integral is the area under its range, scaled so each sample's integrals total the protons the host gives it.
  • Axes: chemical shift across in ppm, falling from left to right, high shift at the left: the convention every published spectrum follows, so a reader finds a proton where the literature puts it. Vertical hairlines in grid at whole ppm, their words under the plot ("7 ppm"). There is no value axis: intensity is in arbitrary units and each sample is scaled to its own tallest line, so heights compare within a sample and never between samples.
  • The offset: each sample on a baseline of its own in base, one pitch above the last, a pitch that holds its tallest line, the names over its multiplets and the integrals under it, so no sample's marks meet another's.
  • The traces: each in its series ink, drawn through each pixel column's first, least, greatest and last value in order, from data finer than a pixel, so a line narrower than a pixel stands at its true height and a quartet stays four lines wherever the room allows; at stroke-signal where a column holds four samples or more, else stroke-line.
  • Names at the marks: each sample named at the end of its trace, in an end gutter as wide as the widest name, in its series-k-of-m-text and value.
  • Multiplets: each named over its tallest line, its assignment in label and its pattern in value and ink ("OCH2 q"). A name that would touch another stands a line higher.
  • Integrals: under the baseline, a bracket in base as wide as the multiplet's range and its value under it in value and ink, in protons to two places ("2.00"). A value that would touch the one beside it stands a row lower.
  • Measurements: the frequency, the solvent, and the measures the host gives (a coupling constant, a shift), name in label, value in value.
  • Options: pitch (between samples, a share of the room each holds), multiplets, integrals, scale (each sample to its own tallest line; common, all to the one tallest, for samples recorded alike), from and to (the shift view). The samples are the data's, never an option.
  • Don't: draw a value axis, or scale one sample to another's height: a reader would compare what is not comparable. And pick no multiplet the host did not: the names and the integrals are the host's, under its ranges.
Rotor run-up: the order tracking chart, drawn by Hue Charts from its own sample.

OrderTracking

A machine's orders against its speed, the first critical marked with its half-power band

Guidelines

Order tracking draws a rotating machine's orders against its speed as it runs up or down, each order named at its end, and the order read's phase in a pane under them.

  • Provide: a run: its speeds in rpm, one a sample, rising or falling; its orders, each its number and its amplitude and phase at every speed; and the amplitudes' unit and what they measure ("Velocity").
  • The amplitudes: 65 % of the room, each order a line at stroke-line in its series-k-of-m, named at its end in its series-k-of-m-text ("1×", "2×"), from naught, hairlines in grid at four to six ticks; the pane is named over it in value by its measure and unit ("Velocity, mm/s").
  • The phase: 35 % of the room, space-pane under the amplitudes and named over its pane ("Phase of 1×, degrees, unwrapped"): the order read's phase in degrees, each angle moved by whole turns to stand within half a turn of the one before, sharing the amplitudes' speeds. Where it cannot stand size-row tall it is left out, and the foot says so.
  • The critical speed: the order read's (1× by default) is the speed of its greatest amplitude among the run's samples, a dashed hairline in ink down through both panes, named over the plot ("First critical, 4,740 rpm" for 1×). Its half-power band, the speeds either side where its amplitude falls to the greatest over √2, each placed on the straight line between the two samples that straddle it, is a band in chip behind the amplitudes. Q is the critical speed over the band's width, and where the run does not fall that far on a side it is not stated, and the foot says why.
  • Speed: along the foot in rpm, in thousands with their separator ("2,000").
  • Measurements: the critical speed, the order read's amplitude and phase there, and Q.
  • Options: orderRead, phase (the phase pane), legend, stripes. Given one run, order tracking and the Campbell diagram read the same critical speed from the same samples.
  • Don't: read the critical from the line as drawn: it is read from every sample, and a dense run's line is drawn by its pixel columns.
Sales by day: the period chart, drawn by Hue Charts from its own sample.

Period

This period to its last day; the one before whole and dashed

Guidelines

A period chart shows this period to its last day against the one before it, day by day, as two lines.

  • Provide: a date and a value to each row (the dates ISO 8601, each read to its day in the time zone given, else the device's), a day with no record given as no value, and the unit. A period with no data is refused, by name.
  • Lines: this period in series one's ink at stroke-line, to its last date; the period before it whole beneath, in series two's ink, thinner, at stroke-edge, and in series two's dash. Both run straight from day to day. A day with no value breaks the line and is never drawn as naught; a lone day between gaps is a point.
  • Axes: days by their number along the foot, a week's by its weekdays and a year's by its months, set every *n*th where they would touch. Hairlines in grid at four to six ticks from naught, the baseline in base.
  • Names: each period is named beside its own line's end in its series-k-of-m-text: after the end where the name fits inside the plot, else over or under it, then a line's height further each way, the first place that crosses neither line nor a word. So a period chart has no key and no chips. The names are not switches: the two periods are one run of dates. Where a name finds no place it is not set, and its period is still told by its dash and named in the notes, the tooltip and the table. legend off sets no names.
  • The notes: the figure sets this period to its last date against the earlier to the same day, never to its whole, the day said once where both stop on it and the earlier's year only where it differs: "To the 15th, 740 sales in October 2025, 702 in September, up 5.4 %". After it, how the days are lined up and the clock that read them.
  • Options: period (week, month, quarter or year), compare (the previous period, or the same one last year), align (last year's days by date, or by weekday, 52 weeks before), through (the last date, else the data's), weekStart, zone, and money's writing where the unit is a currency.
  • Don't: pad a day the earlier period lacks (the 31st against a 30-day month), read a day with no value as naught, or set part of a period against the whole of the one before.
Active users: the sparkline chart, drawn by Hue Charts from its own sample.

Sparkline

One line, no axes, the card's figure

Guidelines

A sparkline: one series as a line with its fade, no axes and no grid, under the card's figure, for a trend at a glance.

  • Provide: one series in order and the figure it stands under; the delta names the period it is against.
  • Draw: the line in series-1-of-4 at stroke-line, the fade from opacity-area to none, the last point at size-point ringed in card. The picture is the figure's shape, so it has no ticks: a reader who needs values reads a Line.
  • Don't: set two series in one sparkline, or start its scale at zero when the change is the point.
Sound level of a spoken syllable: the spectrogram chart, drawn by Hue Charts from its own sample.

Spectrogram

A sound's level by time and frequency, each cell's lightness its level in dB

Guidelines

A spectrogram draws a sound's level by time and frequency, each cell's lightness its level in dB, so a tone stands as a line, a click as a stroke and a noise as a field.

  • Provide: a waveform (its samples at a rate, held or read by range) or spectra already analysed (each a time and its bins' levels); the window, its length and its overlap (Hann, 1,024 samples, 87.5 % by default); and what the dB are against ("full scale", "20 µPa", "1 V").
  • Spectra: each spectrum is the window's stretch of samples centred on its time, the window's coherent gain taken out, so a sine of the reference's amplitude reads 0 dB under any window. A bin's level is 20 log₁₀ of its amplitude over the reference; spectra before the first sample and past the last read the missing samples as naught.
  • Cells: a cell is a spectrum wide and size-count-cell tall, the cells touching with no gap and no lit edge, since their lightness is their value. A row covers the bins whose centres fall in it and takes the greatest level among them; where a row is finer than a bin it takes the line between the bins either side. A cell's fill is its level's place on the key's ramp, seq-1 (the floor) to seq-5 (the top): the ink that inks the key, so a cell and the key agree.
  • The scale: the top is fixed, so levels are absolute whatever the view: the host's top; else 0 dB for a full-scale reference; else the loudest level of the whole waveform at these settings, found once. The floor is dynamicRange dB under it (60 by default); a level under the floor takes seq-1. The key is the ramp with its ends' values in label ("−70 dB", "−10 dB"). Levels are absolute against the reference, never a share of the loudest spectrum.
  • Axes: time across from naught in SI steps ("200 ms", "1.5 s"), frequency up in Hz with its prefix ("2 kHz") from naught to the Nyquist frequency or to frequencyTo. Frequency is linear: speech, birdsong and machines read in equal steps of Hz, where harmonics stand evenly apart and a formant keeps its width. frequencyScale: "log" is for music and wide-band sound, where an octave is the step; it starts at frequencyFloor (20 Hz by default, never naught), its decades labelled and 2 to 9 between them hairlines. No hairlines stand over the cells; the baseline stands in base.
  • Resolution: a bin is the rate over the window's length apart and a spectrum stands a hop after the last, so a long window separates tones and smears an onset and a short one does the reverse; the measurements say both.
  • Measurements: the window (name, length, overlap), the bins and the hop, and the loudest cell with its level, time and frequency.
  • Options: windowName (hann, hamming, blackman-harris), windowLength, overlap, dynamicRange, frequencyScale, frequencyFloor, frequencyTo, from and to (the view, a share of the record's time). The reference and a host's top are the data's.
  • Don't: ink a cell by its share of the loudest spectrum, so a quiet passage keeps its quiet, or smooth the cells so a bin looks finer than the window made it.
Polystyrene film: the spectrum chart, drawn by Hue Charts from its own sample.
Infrared spectrum of polystyrene: the IR spectrum chart, drawn by Hue Charts from its own sample.
Raman spectrum of polystyrene: the Raman spectrum chart, drawn by Hue Charts from its own sample.
UV-Vis spectrum of riboflavin: the UV-Vis spectrum chart, drawn by Hue Charts from its own sample.

Spectrum

Infrared, Raman and UV-Vis spectra, each axis in the direction its field reads it

Guidelines

A spectrum chart draws a vibrational or an electronic spectrum on the axes its field reads it on: infrared with the wavenumber falling and the bands as dips, Raman and UV-Vis with the axis rising and the bands as peaks, each band named by the group that gives it, so a reader looks a compound up in a table without turning the picture round.

  • Provide: the spectrum as the instrument gives it (its values on a steady grid: a first position and a step, in wavenumber, Raman shift or wavelength), the chart (spectrum, whose x rises, or the presets ir-spectrum, raman-spectrum and uv-vis-spectrum), the quantity and its unit (transmittance in %, counts, absorbance in AU), and the host's bands, each its position and the group's name ("Ring C=C"). The chart names no group: it names what the host names, and reads each band's value as the instrument's peak picker does, the extreme of the trace within 12 samples of the position the host gives.
  • Infrared (ir-spectrum): transmittance in % up, 0 to 100, wavenumber in cm−¹ across from 4,000 to 400, falling from left to right, so an absorbing band is a dip. Infrared is read in the order the dispersive instruments scanned it, wavelength rising, and the wavenumber is its reciprocal, so it falls; the group frequencies stand at the left and the fingerprint at the right. A spectrum whose y is absorbance draws its bands as peaks on the same falling axis; nothing is converted.
  • Raman (raman-spectrum): counts up, Raman shift in cm−¹ across, rising from left to right, so a band is a peak. The shift is counted from the laser line and rises away from it, and scattered light is more of something, so more is up.
  • UV-Vis (uv-vis-spectrum): absorbance in AU up, wavelength in nm across, rising from left to right, so a band is a peak. The spectrometer scans short to long, and absorbance is more of something, so more is up.
  • The trace: one waveform in series one, drawn through each pixel column's first, least, greatest and last value in order, at stroke-signal where a column holds four samples or more and stroke-line where fewer. The noise stands as it is.
  • Callouts (ir-spectrum, raman-spectrum): the bands named above the plot, each its group in label and its value, in the preset's unit, in value and ink, with a hairline in base down to the band that stops short of it. A label stands right of its leader, or left where it would pass the end of the plot, in the fewest rows that hold them all: two labels in a row stand apart, and no leader runs through a label. A band that finds no row is left out and counted.
  • Maxima (uv-vis-spectrum): each maximum named by its wavelength and "nm" over its tip, in label.
  • Axes: values at four to six ticks with their unit ("75 %", "0.4 AU"), hairlines in grid and the least in base; across, ticks with the unit ("3,000 cm−¹", "300 nm"), each a whole step apart and none closer than its words. Counts take no unit on the tick: the context names them. The face carries no superscript minus, so the wavenumber unit is a minus and ¹.
  • Measurements: the range, the step and the strongest band for ir-spectrum and raman-spectrum (with the laser's wavelength for raman-spectrum); the maxima, the concentration and the path for uv-vis-spectrum.
  • Options: direction (rising by default, ir-spectrum falls; a host that reads a Raman spectrum the infrared way), from and to (the view), callouts. The bands are the data's, never an option.
  • Don't: draw one preset in another's direction without the host's asking, or put two presets on one axis: they differ in direction, and a reader who finds a Raman spectrum falling or an infrared one rising reads the wrong region.
Engine noise in a run-up: the spectrum waterfall chart, drawn by Hue Charts from its own sample.

SpectrumWaterfall

Spectra at successive speeds stacked back to front, the nearer hiding the farther

Guidelines

A spectrum waterfall draws spectra one behind another, each at its own speed or moment, nearest first and the nearer hiding the farther, so how a spectrum changes shows as ridges: an order rising on a diagonal, a resonance standing in place. Its word is "spectrum waterfall" (spectrum-waterfall), since waterfall is the bridge chart's.

  • Provide: the spectra in order, each its level in dB at every frequency; what steps from one to the next (speed in rpm, or time) and its value at each; what the dB are against ("20 µPa"); and the window and averages that made each spectrum.
  • Lines: one a spectrum in series-1-of-4 at stroke-signal, since fifty lines at stroke-line merge. Each stands offsetUp up and offsetAcross across from the one before (3 px and 1 px by default, the up step the least of offsetUp and what the plot's height holds), the first nearest and lowest. Painted farthest first, each in card from its line down to its baseline before its line is stroked, so the nearer hides the farther.
  • The loudest: its line at stroke-line, a point at its peak (size-point, ringed in card), its step named in series-1-of-4-text in value.
  • The depth axis: along the baselines' right ends, a name at each round step ("1,000 rpm") in label and muted, at least space-label apart, a step that would stand nearer than that to the loudest's name left out.
  • The scale: one for every line, a bar in ink at stroke-focus at the left, size-row tall, holding a round level ("20 dB"); a level under the floor stands on its baseline. Decibels are values on a linear scale.
  • Axes: frequency across along the nearest baseline in base, linear in Hz from naught, since orders then stand as straight diagonals and harmonics evenly apart; its words under it with their prefix ("200 Hz"). No hairlines stand behind the lines: the nearer would hide them.
  • The key: a stroke in the series' ink: "One spectrum at one speed".
  • Measurements: the spectra and their step, the window and its averages, and the loudest spectrum's level with its frequency and step.
  • Options: nearest (which end of the run is nearest), offsetUp, offsetAcross, scaleBar, frequencyScale (log for audio). The floor and the orders (dashed hairlines in ink along an order's ridge, each named at its end in label) are the data's.
  • Don't: fill a line in any ink but card, which lets the farther show through the nearer, or compare two lines' levels by their heights on the page: they stand offset, so a level is its line's rise over its own baseline.
Generation mix: the streamgraph chart, drawn by Hue Charts from its own sample.

Streamgraph

Layers about a moving baseline, each named at its end

Guidelines

A streamgraph shows how a whole divides among its parts through time, the layers stacked about a baseline that moves.

  • Provide: the categories in order and one series a layer, each a value to every category. A missing value is refused: a stack draws no gap, since every layer above a hole would move.
  • Layers: each as a stacked Area's, filled solid in its series-k-of-m-edge, its top carrying its line in series-k-of-m at stroke-line; the first lowest and the rest above it. Smoothed, each edge is a monotone curve through the categories that never passes a value. Layers that touch are parted by the card, an edge of it about every fill and a casing of it under every line; a layer carries no fade.
  • Baseline: the wiggle (Byron and Wattenberg's: it starts centred and steps so that the weighted change of every layer's middle is least), the silhouette (centred on zero) or zero (stacked from the axis). With the first two, a layer's thickness is its value and the baseline is not zero. There is no value axis.
  • Names at the ends: each layer is named at the middle of its band at the last category, in series-k-of-m-text, in an end gutter, names pushed space-label apart and joined to their layers by a hairline leader where one moved. The names are the layers' switches, so a streamgraph has no chips.
  • Grid: about eight upright hairlines in grid, none across; the category words under the plot, set every *n*th where they would touch.
  • Options: offset (wiggle, silhouette or zero), smooth (curved layers, on), grid, xAxis.
  • Don't: fade a layer, or read zero from the baseline: with the wiggle or the silhouette it moves.
Gearbox rig vibration: the strip chart, drawn by Hue Charts from its own sample.

StripChart

Waveforms on their own baselines under one time axis, a row a waveform

Guidelines

A strip chart draws waveforms on their own baselines under one time axis, a row a waveform, as a recorder draws its channels.

  • Provide: rows, top to foot, each a waveform (its samples at a rate and its unit, held or read by range) or a run of segments, each a waveform over a stretch of the span, as an ECG's leads are; each row's group where the rows have them (a rig's axes, an EEG's chains), and the groups' names; the record's events where it has them.
  • Rows: each on its own baseline, at least size-row tall, and 10 mm at a physical scale. Groups whose rows stand together stand space-group apart. A waveform is drawn through each pixel column's first, least, greatest and last sample, at stroke-signal where a column holds four samples or more, in its group's series-k-of-m (series one where the rows have no groups). A row's swing past its height is drawn, never clipped.
  • Names at the marks: each row is named at its start in the lead column, in value, in its group's series-k-of-m-text. A group whose rows stand together is named in the lead column's outer part at its middle; a group whose rows interleave (X, Y and Z under each sensor) is named by its rows' names alone. A segment's name stands at its start inside its row, on a plate of card, a short base mark where one segment gives way to the next.
  • Time: a hairline in grid at each time tick down through the rows (or one each second, gridLines), the ticks' words under the plot in label: SI steps under a second ("200 ms"), the clock's above it, and the clock's time where the record gives its start and clockTime asks for it.
  • The scale: one for every row, said in the key as a bar in ink as tall as the value it holds: "0.5 g on every row", and with a time bar beside it where the rows are read in seconds ("100 µV, 1 s on every row"). A row given its own scale says it beside its name.
  • The cursor: a hairline in ink down through every row, its handle over the rows: size-handle tall, a quarter of that wide, its ends round, in base, its time beside the handle in value. The end column gives each row's value at the cursor in value, signed and tabular, in the prefix its scale takes, so the column's figures line up.
  • The overview: where not every row fits, a column at the end draws each row as one cell of its RMS on seq-1 to seq-5, a frame in ink round the rows drawn, held by a handle; its key is the class strip "RMS of each row, the overview" with the values its steps stand at.
  • Measurements: the measurements row under the plot: the rows and their rate, the samples, the cursor's time where there is a cursor, and the loudest row by its RMS.
  • Options: rowsFrom (the first row shown), rowScale (what a row holds; naught, its swing), cursor and cursorAt, from and to (the view, paged by Page Up and Page Down), polarity (negative up for EEG, said in the foot), highPass, lowPass and notch (display filters, said in the context line), speed and sensitivity (a physical scale, said in the context line), clockTime, gridLines, baseline (each row's mean or naught) and pulse.
  • Don't: clip a row to its height, or scale rows each their own way without saying it beside their names: the bar in the key says one scale holds for every row.
Revenue bridge: the waterfall chart, drawn by Hue Charts from its own sample.

Waterfall

Totals, steps up and down, each step's value in words

Guidelines

A waterfall shows how a total changed, step by step, from one total to the next.

  • Provide: the opening total, each step's change with its name, and where the running total stands as a total.
  • Marks: totals stand from zero in series-1-of-4 with their lit edge; each step floats from the running level to the next, in rise where it adds and fall where it takes away, its value end rounded (a decrease's at its foot). A hairline in base carries the running level from each step to the next.
  • Words: each step's value above an increase and below a decrease, signed ("+180", "−60"), so the sign is in the words and never in the ink alone; each total's value above it. The key says what the three inks mean.
  • Don't: reorder the steps by size, or start the scale anywhere but zero.

Compare

Sales by region: the bar chart, drawn by Hue Charts from its own sample.

Bar

Ranked across, and two sides back to back

Guidelines

A bar chart is Column's module laid across: for long category names, a ranking, or two sides back to back.

  • Provide: the categories and one or more series; for two sides back to back (the population pyramid), the two series and the share or count each side holds.
  • Bars: the far end rounded radius-bar and lit, the base end square; size-band of the band. Category names stand in the lead column in label, as wide as the widest, and a value may stand at the bar's end in value.
  • Grid: a chart laid across keeps vertical hairlines at its ticks, the zero line in base.
  • Two sides: each side named over its half in its series-k-of-m-text; the scale is the same on both sides and reads outward from zero, unsigned. Its categories, the ages, stand down the middle between the two sides, beside both of an age's bars, and each side's baseline is that column's edge (PopulationPyramid).
  • Don't: rank by anything but the value shown, or let a pyramid's two halves take different scales.
Sales by region: the column chart, drawn by Hue Charts from its own sample.

Column

Stacked and named, below zero, and Crisp

Guidelines

A column chart compares values across categories: grouped, stacked, or above and below zero.

  • Provide: the categories and one or more series; say in the context when they are stacked.
  • Rounded (the default): the value end rounded radius-bar, at most half the bar's width, the baseline end square, whichever way the bar points: a column below zero is rounded and lit at its foot. Crisp, the host's other shape, squares every corner and keeps the gaps and the edge.
  • Grouped: the bars fill size-band of the band, space-part apart; every series keeps its place in every group, and the chips name them in that order and say so in the notes (the Card shows it).
  • Stacked: segments space-part apart with the card between them, only the outer end rounded, each segment lit at its top; each series named beside the last stack, in series-k-of-m-text.
  • Grid: the zero line in base, wherever zero falls.
  • Don't: stroke a bar, or draw stripes unless the host asks for print or monochrome.
Population by age: the population pyramid chart, drawn by Hue Charts from its own sample.

PopulationPyramid

Two sides back to back, the ages down the middle, one scale

Guidelines

A population pyramid shows how a population spreads across its ages: two sides back to back about one column of bands.

  • Provide: the age bands, the first at the top, and for each side its name and one value to every band, a count or a share, naught or more. A side with more or fewer values than bands is refused.
  • Bars: one a band on each side, rising outward from the middle in series one (left) and series two (right): the far end rounded radius-bar and lit, the middle end square, each filling size-band of its band, as every bar does.
  • Sides: each named over its half in its series-k-of-m-text, so the place and the name tell them apart.
  • The ages: down the middle in label, every k-th band, the least k that holds each name a line clear of the next. Each side's baseline is the middle column's edge, in base.
  • The scale: one scale for both sides, from zero outward to the largest value on either, unsigned. Its ticks stand under each side in label, with grid hairlines through the bands at them.
  • Options: share (on) writes each value as a share of the two sides' whole, its ticks and values in percent with a space before the sign ("4 %"); off, the values as given. values writes each bar's value at its end in value.
  • Don't: give the two halves different scales, or sign the left side's values negative: the scale reads outward from zero.
Player profiles: the radar chart, drawn by Hue Charts from its own sample.

Radar

Rings and spokes, each series named at its last vertex

Guidelines

A radar compares a few things across the same handful of measures on one scale, each a closed shape.

  • Provide: three to eight measures on one scale (a score out of 100), and two or three series.
  • Marks: each series' shape filled at opacity-area and outlined at stroke-line in its ink; rings at the scale's steps and spokes in grid, the measures named in label beyond the spokes.
  • Names: each series named at its last vertex in series-k-of-m-text, pushed apart and led where they meet. The rings' values are said in the notes, since on the plot they would stand on the fills.
  • Don't: mix measures of different scales, or draw more than three series: compare them as columns.

Against a target

Targets this month: the bullet chart, drawn by Hue Charts from its own sample.

Bullet

The measure on its bands, the target a tick

Guidelines

A bullet chart shows several measures each against its target and its bands of poor, fair and good, row by row.

  • Provide: each measure's value, target and band edges, poor to good, and its name with its unit.
  • Marks: the bands behind in band-1 to band-3, space-part apart, the last rounded radius-cell; the measure a third of the band's height in series-1-of-4, its far end rounded and lit; the target a tick across in ink at stroke-line. Each measure has its own scale; the value stands at the right in value.
  • The key names the measure, the target and the three bands, so no band is told by its shade alone.
  • Don't: colour the measure by whether it met its target: the tick says that.
Conversion: the gauge chart, drawn by Hue Charts from its own sample.

Gauge

The arc lit along its outer edge, the target a tick across it

Guidelines

A gauge shows one value against its range and its target, the value in words at its centre.

  • Provide: the value, the range's ends and the target; the unit.
  • Marks: an arc of 240°, the value from the start in series-1-of-4, square at its ends and lit along its outer arc; the rest of the range a track in grid, space-part clear of the value. The target a tick across the ring in ink at stroke-line, named in label.
  • Words: the value at the centre in headline, under it how far it stands from the target; the range's ends at the arc's ends.
  • The figure: a gauge answers last, never total: asked for a total, it refuses by name.
  • Don't: colour the arc by bands of good and bad, or draw a needle.

Hue Web Components

Orders, October: the calendar chart, drawn by Hue Charts from its own sample.

Calendar

<hue-calendar>: a month of days, each by its count

Guidelines

<hue-calendar> shows a month or a year as a grid of days, each day's lightness its value.

  • Provide: dated values, the time zone they are read in, and the month or the year to show; the week starts on Monday unless the host's locale says otherwise.
  • Days: cells on the sequential scale, seq-1 to seq-5, rounded radius-cell, space-part apart, with no lit edge; the date at the top left in label and the value at the bottom right in value, both under the rule for words on a mark. A day with no record is a hairline outline in grid carrying only its date, and the notes say so.
  • The key: the scale's ramp with its ends' values.
  • Wears the same card, type, colour, geometry and states as every Hue Chart. Power BI carries Hue Charts, not the web components.
  • Don't: colour a day with no record as a zero.
GDP per person: the choropleth chart, drawn by Hue Charts from its own sample.

Choropleth

<hue-map>: the choropleth's parts as tiles, tinted by class, the classes keyed

Guidelines

<hue-map>'s choropleth shows how a measure varies by region: each region tinted by its value's class.

  • Provide: a value to each region by its key, the measure's label and the unit. The regions are the set the option names, keyed by code or by name (countries by ISO alpha-3, world regions by UN M49, country regions by ISO 3166-2, US states by postal code, UK regions by ITL code), or the host's own, each an id, a name and its rings. A value keyed by no region drawn, a country too small for the 1:110m map, is drawn nowhere, stands in the class breaks and is said in the notes.
  • Classes: at most classes (3 to 9, six unless asked), cut on the scale: quantile unless asked, log or linear. Only the steps the values make count: a cut repeated, or at or below the lowest value, closes no class, so fewer classes stand where the values make fewer, and one value is one class, drawn in the top class's ink.
  • Regions: each tinted by its class on the sequential scale, the larger the class the further from the ground, with no lit edge, the card between regions as their borders (borders, on). A region with no value is the land's grey, a step off the card, in no class, and its tip says "no data".
  • The key: the classes in the strip under the map, size-class-strip tall: the measure's label above in chip-text, a swatch to each class, the swatches touching with space-part of card between, and each cut's words in label at the gap between two swatches, in one form (1.2k, 3.1k). It is the scale and not the data; legend (Colour key) turns it off.
  • Options: regions (countries, world regions, country regions, US states, UK regions), country, projection (equal-earth, equirectangular, mercator), graticule (on: grid hairlines every 30°), scale, classes, borders, legend, and money's rounding and negatives.
  • Wears the same card, type, colour, geometry and states as every Hue Chart. Power BI carries it, as a view of <hue-map> that reads a table.
  • Don't: ink a region with no value as the least class, or leave unsaid a value the map cannot draw.
The time in London: the clock chart, drawn by Hue Charts from its own sample.

Clock

<hue-clock>: the time in a zone on a face, its city under it

Guidelines

<hue-clock> shows the time in one zone on an analogue face, its hands at the reading it is given.

  • Provide: the zone (an IANA name such as Europe/London, UTC or a fixed offset; the device's where none is given), the name to say it by where the host has one, and the reading to draw: the wall clock's instant with the monotonic clock's. A zone named by an abbreviation (BST, CST) is refused, naming it. Given no reading, the face draws the device's time and says so.
  • The face: a disc of card under a stroke-hairline ring in line; the hours' ticks in base at stroke-line, the minutes' in faint at stroke-hairline, shorter; the hours named inside the ticks in label. Every hour is named from 128 px across, the quarters from 96 px and none below that, and the notes say so; a face under 48 px across is refused, naming the size that draws.
  • The hands run from twelve, clockwise, worked from the zone's clock fields alone. The hour hand is half the radius and the minute hand three quarters, both in ink with round ends, over a cap in ink. The second hand, in series-1-of-4, runs through the centre to a short tail, over the cap. The hour hand turns twice a day, or once on a 24-hour dial.
  • The words: the zone's city under the face in value ("London" from Europe/London, or the host's name) and, with Date on, the day under it in label. The notes say what the picture holds of its reading: "held at 14:03", "drawn at this device's time: no reading given", and "the device's zone, Europe/London" where the zone is the device's.
  • Choices: Dial (12 hours, 24 hours), Numerals (all, quarters, none), Ticks (minutes, hours, none), Seconds (on), Glide (off: the second hand ticks; on: it sweeps) and Date (off).
  • The controls are native buttons in the row under the picture: Seconds, a switch, and Hold, which reads Resume while held. A held face stands at its reading and says it. A page that leaves the row out with controls="none" drives the face by its heldAt and seconds properties and press(name).
  • Wears the same card, type, colour, geometry and states as every Hue Chart. Power BI carries Hue Charts, not the web components.
  • Don't: name a zone by an abbreviation (one abbreviation names several zones), or leave a still without its reading: a face given none draws the viewer's now.
The winter sale: the countdown chart, drawn by Hue Charts from its own sample.

Countdown

<hue-timer>: the time left as figures, a ring emptying clockwise round them

Guidelines

<hue-timer>'s countdown shows the time left to an instant, or of a length, as figures with a ring emptying round them.

  • Provide: an instant (until, ISO 8601; one with no offset is read as a wall time in zone, and the notes say so) or a length (length, an ISO 8601 duration of days at most such as "PT10M", or seconds), one of them and never both; its name (label); where an instant's ring is full (since). The countdown is <hue-timer>'s default view.
  • Figures: the time left in the largest units it needs ("12 d 04:10:22", "04:10:22", "09:41", "0:07"), its seconds rounded up so "0:00" stands only at naught, in ink at display-large, display or display-small: the largest the room inside the ring gives. A room too small for display-small is refused, naming the size it needs.
  • The ring: full at the start and emptying clockwise to naught: the time left in series-1-of-4, lit along its outer arc in series-1-of-4-edge, on a track in grid. Where since is not given an instant's ring is full at the reading it is drawn at, so give since for it to empty. A length's ring is full before it starts.
  • Words: the name over the figures in value. At naught it stops at "0:00" and says "ended at 10:20" under the figures in label; with end set to over it counts on past naught after a minus sign, the word "over" under it in fall-text, never the ink alone.
  • Controls: native buttons under the picture. To an instant: Seconds, and Hold, which reads Resume while held. Of a length the countdown is a timer: Start, which reads Pause while it runs, and Reset; it takes no lap.
  • Wears the same card, type, colour, geometry and states as every Hue Chart. Power BI carries Hue Charts, not the web components.
  • Don't: colour the ring by how little is left: it stays series one's ink to naught, and the figures and the words say the rest.
A working day: the day dial chart, drawn by Hue Charts from its own sample.

DayDial

<hue-clock>: a day's events as arcs round a 24-hour face, the hour hand at now

Guidelines

<hue-clock>'s day dial shows one day of a zone on a 24-hour face, each event an arc from its start to its end.

  • Provide: the events, each with a label, a start and an end (an ISO 8601 instant, a wall time in the zone, or a time of day alone) and a group; the zone, the device's where none is given; the reading; and Day (YYYY-MM-DD) where it is not the reading's day. Times of day alone are a routine: no day is named, and an event that ends earlier than it starts runs through midnight as one arc.
  • The face: the clock's on 24 hours, midnight at the top: hour ticks in base at stroke-line, no minute ticks, the hours named inside them in label, 0 to 23, or "1 am" to "12 pm" under Clock: 12-hour.
  • Arcs: each on a track inside the named hours and clear of the hub, 8 to 20 px wide, in its group's ink, square at its corners and lit along its outer arc. Events that overlap stand on tracks inward of one another, one through midnight first and then by start, as many tracks as the room holds; the rest are counted in the notes and kept in the table.
  • Names: an event's name along its arc in label where it fits, else in its tip, set so that it never stands upside down: on the lower half its tops point to the centre.
  • Groups are the series, in the order of series-k-of-m. The first is solid and each after it wears its own hatch, so the pattern tells the groups apart as well as the ink; chips under the dial name them where there is more than one.
  • Now (on by default): the hour hand, in ink with a round end, reaches the outer track over a cap in ink, at the zone's time where the day shown is today, or always for a routine; the arcs before it are drawn back at opacity-dim. Hold, which reads Resume while held, is the only control, a native button in the row under the picture, and it stands only while the hand is drawn.
  • The notes on a dated day, read in the zone's wall-clock time: where its clocks skip forward or go back, where an event runs on from the day before or to the day after, how many events fall on other days, and the day shown with its zone.
  • Wears the same card, type, colour, geometry and states as every Hue Chart. Power BI carries Hue Charts, not the web components.
  • Don't: give an event a start and no end, or mix times of day alone with dated events: the view refuses both.
The time in London: the digital clock chart, drawn by Hue Charts from its own sample.

DigitalClock

<hue-clock>: the time in a zone as figures, the date and the zone under them

Guidelines

<hue-clock>'s digital clock shows the time in one zone as figures, with the date and the zone under them.

  • Provide: as the clock: the zone (an IANA name, UTC or a fixed offset; the device's where none is given), the name to say it by where the host has one, and the reading to draw. Given no reading, it draws the device's time and says so.
  • The figures: the time written whole as one word in ink, its seconds where asked and its day period where the hour cycle has one, in the largest of display-large, display and display-small that its room gives. The room kept is the house's widest writing of the time, day period and all, and a fifth more. No separator blinks. A width or a height too small for display-small is refused, naming what it needs.
  • The words: under the figures in label, the date ("Thu 15 Jan 2026") where Date is on; the city with its offset from UTC ("London · UTC", "Kolkata · UTC+5:30"); then what the picture says of its reading ("held at 14:03", "drawn at this device's time: no reading given").
  • Choices: Clock (locale, 24-hour, 12-hour; the locale's by default), Seconds (on) and Date (on).
  • The controls are native buttons in the row under the picture: Seconds, a switch, and Hold, which reads Resume while held. A held clock stands at its reading and says it.
  • Wears the same card, type, colour, geometry and states as every Hue Chart. Power BI carries Hue Charts, not the web components.
  • Don't: blink the separator, or set the figures in a size of your own: the view takes the largest display step its room gives.
Container shipping lanes: the flow chart, drawn by Hue Charts from its own sample.

Flow

<hue-map>: routes from each origin, each origin named at its marker, no key

Guidelines

<hue-map>'s flow shows what moves between places: each route an arc from its origin, as wide as its volume.

  • Provide: the routes, each from an origin to a destination (a city's name, or its longitude and latitude) with its volume; the unit the volumes are in, for the context line.
  • Marks: each route an arc along the great circle from origin to destination, in its origin's ink, from 0.8 px wide to its widest (5 px unless asked) by the square root of its volume, the largest drawn last; it leaves its origin's marker, a dot of the origin's ink ringed in card. A destination that is no origin is a small dot in base ringed in card. The land is a grey a step off the card, the graticule grid hairlines where it is asked for.
  • Origins are the series, each named beside its marker in its series-k-of-m-text: to the right of it, else to the left, above or below, wherever the name stands clear; over a route it stands on a plate of card, as any name among marks does. The name is the origin's switch, so a flow has no chips and the map keeps its height; an origin whose name finds no room is told by its ink and in the data table, which lists every route. While an origin is hidden, the chips come back, so it can be shown again. Destinations are named in label where the values are asked for.
  • Don't: draw a key of the origins under the map, or name a destination in an origin's ink.
Launch plan: the Gantt chart, drawn by Hue Charts from its own sample.

Gantt

<hue-gantt>: tasks, what is done of each, and today

Guidelines

<hue-gantt> shows a plan: each task's span on a calendar, how much of it is done, and today.

  • Provide: the tasks with their start, end, phase and the share done; the date today; the time zone.
  • Marks: each task's span outlined at stroke-edge in its phase's ink, a pill, and what is done filled from its start, so the shape says what is done as well as the ink; the share in words on the filled part where it fits, else beside it. Weeks are hairlines in grid named along the top.
  • Today: a line in ink at stroke-focus through every lane, named under the plot.
  • Phases are the series: each named over its own tasks in its series-k-of-m-text, so the place and the name tell the phases apart as well as the ink. The name is the phase's switch, so a Gantt has no chips. It is the lanes module's tasks preset, beside <hue-timeline>.
  • Don't: colour a task by whether it is late: say it in words, in the tooltip and the notes.
Pump status: the status timeline chart, drawn by Hue Charts from its own sample.

StatusTimeline

<hue-timeline>: each row's state over time, a gap left as ground

Guidelines

<hue-timeline>'s status timeline shows each row's state over time: a band for every stretch, in its state's ink.

  • Provide: the stretches, each with its row, its start, its end and its state; the time zone the dates are read in; the range to show. It is shown by <hue-timeline chart="status-timeline">. A date is ISO 8601 text or a Date: a day alone is the day it names, and as an end the whole of that day. A stretch with no start or no end is refused by name, and so are two stretches of one row that overlap, since a row is in one state at a time; two that meet end to end do not overlap.
  • Lanes: one a row, in the order the data first gives them, named down the left in label. Each lane's line runs through its middle in faint, under its bands.
  • Bands: a stretch is a band from its start to its end across its lane, rounded radius-tile, with no lit edge, and at least a pixel wide so a moment's fault is seen. Where no stretch covers the time the lane is left as ground, never filled, so no state is claimed for it.
  • States are the series, in the order the data first gives them: each its own ink and, after the first, its own hatch, so a reader who cannot tell the inks apart tells the states apart. Chips under the plot name them, each with a swatch of its state's ink or hatch.
  • Dates: along the foot by the calendar in label ("7 Oct", "Oct 2025", "2025"), each with its line through the plot in faint where the grid is asked. Today is a line in ink at stroke-focus through the plot, named "today" over it in value, where today falls in the range.
  • Range: All, 1M, 3M, 6M, YTD or 1Y back from the last date, set by the host or by the Range buttons in the controls row under the picture. The notes count the stretches it leaves out and say the clock the dates are read by ("times by this device's clock (Europe/London)", or "times in" the zone given).
  • Wears the same card, type, colour, geometry and states as every Hue Chart. Power BI carries Hue Charts, not the web components.
  • Don't: fill a gap with the state either side of it: a gap is the lane's own line, and no state is claimed there.
Interval run: the stopwatch chart, drawn by Hue Charts from its own sample.

Stopwatch

<hue-timer>: the time run to the hundredth, and each lap under it

Guidelines

<hue-timer>'s stopwatch shows the time run to the hundredth, with its laps listed under it, newest first.

  • Provide: its timer's state (whether it runs, the time banked and its laps, each the time run at it); with none it stands stopped at naught. It is shown by <hue-timer chart="stopwatch">.
  • Figures: the time run, "01:23.45", and past an hour "1:02:03.45", in ink at display-large, display or display-small: the largest its room gives. hundredths turns the hundredths off. A room too narrow for the widest writing at display-small is refused, naming the width it needs.
  • Laps: under the figures in label, centred, one line each: its number, its lap time and its total ("Lap 3 · 00:20.86 · 01:03.87"). Once there are three, the fastest and the slowest are named so in words after them. As many laps show as the room holds, the rest counted on the last line ("and 2 laps more, in the table") and every one in the table.
  • Controls: native buttons under the picture: Start, which reads Pause while it runs; Lap, which a paused stopwatch cannot take; and Reset. It runs on while the page is left and the device sleeps. Under a wish for less motion a running stopwatch changes once a second.
  • Marks: none. The figures and the laps are words, and they are the data.
  • Wears the same card, type, colour, geometry and states as every Hue Chart. Power BI carries Hue Charts, not the web components.
  • Don't: name the fastest or the slowest lap by ink alone: the words stand beside the lap.
Product launch: the timeline chart, drawn by Hue Charts from its own sample.

Timeline

<hue-timeline>: events on lanes by date, a bar where one runs a while

Guidelines

<hue-timeline> shows events on a date axis, one lane a group: a point at each date, a bar where an event runs on.

  • Provide: the events, each with its name, its date, its end where it runs on and its group; the time zone the dates are read in; the range to show. A date is ISO 8601 text or a Date: a day alone is the day it names, and as an end the whole of that day. The timeline is <hue-timeline>'s default view.
  • Lanes: one a group, in the order the data first gives them, named down the left in label; events with no group share a lane named "Events". Each lane's line runs through its middle in faint, under its marks, so a stretch with nothing on it reads as an empty lane.
  • Marks: an event with no end is a point in its group's ink; one with an end is a bar from its start to its end, 18 px tall at most, rounded radius-tile. The lanes name the groups, so a timeline has no chips: a group after the first wears its own marker on its points (a square, a triangle, a diamond) and its own hatch on its bars, as well as its ink.
  • Names: each event's name in value, over its point or from the start of its bar, above it, and below it where above would touch a name already set. A name never stands on a bar, whose ink and hatch no word holds against.
  • Dates: along the foot by the calendar in label ("7 Oct", "Oct 2025", "2025"), each with its line through the plot in faint where the grid is asked. Today is a line in ink at stroke-focus through the plot, named "today" over it in value, where today falls in the range.
  • Range: All, 1M, 3M, 6M, YTD or 1Y back from the last date, set by the host or by the Range buttons in the controls row under the picture. The notes count the events it leaves out ("3 events before the 3M range from 2025-09-17") and say the clock the dates are read by ("days by this device's clock (Europe/London)", or "days in" the zone given).
  • Wears the same card, type, colour, geometry and states as every Hue Chart. Power BI carries Hue Charts, not the web components.
  • Don't: show a task's progress on a timeline: the Gantt is tasks with progress in their own rows, and a timeline is events on lanes.
London this week: the weather board chart, drawn by Hue Charts from its own sample.

Weather

<hue-weather>: a week's highs and lows as one band, and the picked day's hours

Guidelines

<hue-weather> shows a week's forecast: each day's low to its high as one band across the week, and the picked day's hours.

  • Provide: a row a day (its date, high and low, and where known its rain, wind and Open-Meteo weather code), each day's 24 hourly temperatures where known, and the units the numbers are in. A unit is printed only where the data gives one; °F converts only temperatures given in °C.
  • The header is the card's: the host's title, else the city, and the host's context ("London this week", "Highs and lows in °C, rain in mm").
  • Days: one column each, equal widths. At its head the day's short name in label, its sky in one word in muted (the code's kind: Clear, Cloud, Rain, Showers, Snow), and its rain in muted only on a day with rain; its wind under that only where the host asks.
  • The band: series one's ink, from each day's low to its high, filled at opacity-area; its top a line stroke-line wide through the highs, its foot a stroke-hairline line through the lows; smooth in either shape, a monotone curve, since a temperature moves smoothly between the days it is read on. Each high in value over its day, each low in label under it. No axis, no grid, no colour by temperature.
  • The picked day: its name on a chip, and a point (size-point, ringed in card) at its high and its low. A click on a day picks it.
  • The hours: under the band, the picked day's 24 temperatures as one line in the same ink, stroke-line, with no grid and no scale: its lowest and highest each a point with its value, 00h, 06h, 12h and 18h under it in label, and its name over it ("Wed 23 by the hour"). A day with no hours says so in the notes, and the hours' room collapses; a card too low for them draws the week alone and says in the notes the height that holds them.
  • The notes: "Codes read as Open-Meteo lists them, read 2026-09-28", and where the days were read from instants, the clock that read them.
  • Wears the same card, type, colour, geometry and states as every Hue Chart.
  • Don't: colour a day by its temperature (a scale between two extreme days claims warm and cold the data never said), draw rain as bars, or box the picked day.
Offices round the world: the world clock chart, drawn by Hue Charts from its own sample.

WorldClock

<hue-clock>: the time in several zones side by side, each against here

Guidelines

<hue-clock>'s world clock shows the time in several zones side by side, each told against the zone it is read from.

  • Provide: the zones, each by its IANA name and, where the host has one, the name to say it by; here, the zone the others are told against (the device's where none is given); and the reading to draw. A zone the charts do not read, an abbreviation among them, is refused, naming it.
  • Cells: as many across as hold a cell 120 px wide, here first and said "here". Each holds the time, in figures in the largest of display-small, headline and value that the cell gives with its words under them, or on a small face (Form: analogue); under it the city in value, and in label its offset against here: "-5 h", "+5 h 30 min", "same time".
  • Days: each zone's date is read in that zone. A cell on another day than here's says so after its offset: "tomorrow", "yesterday", "2 days ahead" or "2 days behind".
  • Night: a cell whose hour is from 18:00 to 06:00 stands on chip and says "night" in its words, so the tone is never the only cue. The notes say it once, "night from 18:00 to 06:00, by the clock, not the sun", since the library knows no place's sunrise.
  • Choices: Form (digital, analogue), Clock (locale, 24-hour, 12-hour) and Seconds (off).
  • The controls are native buttons in the row under the picture: Seconds, a switch, and Hold, which reads Resume while held. A held clock stands at its reading and says it.
  • Wears the same card, type, colour, geometry and states as every Hue Chart. Power BI carries Hue Charts, not the web components.
  • Don't: tell night by the sun or by the tone alone, or tell a cell's zone by its abbreviation.

Relationship

Rotor run-up modes: the Campbell chart, drawn by Hue Charts from its own sample.

Campbell

Orders against natural frequencies across the speeds, each point sized by its amplitude

Guidelines

A Campbell diagram draws a rotating machine's orders against its natural frequencies across its speeds, each point sized by its amplitude, so the speeds where an order meets a mode stand out.

  • Provide: a run as order tracking reads it (its speeds in rpm, each order's amplitude at every speed, the amplitudes' unit and what they measure), and the rotor's natural frequencies the host gives, each its name and its frequency at two speeds or more.
  • Orders: each a hairline in base from the origin, its frequency its multiple of the speed, named at its end in its series-k-of-m-text ("1×", "2×"). Its points stand along it a point's width apart in its series-k-of-m, ringed in card, each sized by its amplitude as the Scatter sizes a point: size-scatter × (0.5 + 1.5 × the root of its amplitude over the most). Where fewer points stand than samples, the foot says how many ("A point every 27 samples, 110 of 2,855").
  • Modes: each natural frequency a dashed hairline in ink through its speeds, named at its start in label where the name stands clear of every other word.
  • The critical: the order read's critical speed, read from every sample of the run as order tracking reads it, a dashed hairline in ink down the plot, named over it beside the line ("First critical, 4,740 rpm" for 1×).
  • Axes: frequency up in Hz from naught to the highest order's at the top speed, or the highest mode's where it stands above; speed across in rpm from naught.
  • The key: discs in base at round amplitudes up to the most, each sized as a point of that amplitude ("2 mm/s", "4 mm/s").
  • Measurements: the critical speed, and the most amplitude with its order and its speed.
  • Options: orderRead, legend, stripes. A Campbell diagram keeps no time, so under right to left it mirrors whole.
  • Don't: read a critical off the points drawn: they stand a point's width apart, and the critical is read from every sample.
Neutron and density of one well: the cross-plot chart, drawn by Hue Charts from its own sample.
A log drawn at five metres a second

CrossPlot

One series against another, a point for each depth, coloured by a third, with the host's lithology lines marked in porosity

Guidelines

A cross-plot draws one series against another, a point for each depth sample, coloured by a third, so where the readings fall among the host's lines, and what the third series does there, read at a glance.

  • Provide: three series, a value in each at every depth sample of the well (neutron porosity, bulk density and gamma ray in the sample) and the NULL value that stands for one missing: a sample with any of the three missing is no point, and is counted. The colouring series comes with its lo and hi where the data gives them (0 and 200 API in the sample); each axis comes with its series and its limits. The lines are the host's data: each a name and its points. The library computes no lithology line and copies no vendor chartbook.
  • Axes: the x measure across and the y measure down, each linear unless xLog or yLog asks for a log axis, which takes only positive limits and refuses others; each axis's limits are the host's, else the series' extremes over the points drawn. A hairline in grid and its word in label at each of the library's round ticks, the words under the plot and in the lead column, the baseline in base. The sample runs neutron porosity -0.05 to 0.45 v/v across and bulk density 1.9 to 3.0 g/cc down, density increasing downward (yReversed); the context line says which runs where, with units.
  • Points: each size-scatter, filled by the third series on the five seq steps, each step centred on 0, a quarter, a half, three quarters and all of the range from the colouring series' lo to its hi where the data gives them, else its least and greatest over the points drawn (0, 50, 100, 150 and 200 API in the sample), in depth order. A point is ringed 1 px in base and not in card: the scale's first steps stand near the ground, and a point still has to show.
  • The key: the strip's label "Gamma ray, API" in chip-text, the five steps, and the first's and last's words ("under 25", "175 or more").
  • The lines: the sample's three lines are the host's, handed in with the points: straight lines of ρ = ρma - φ(ρma - ρf), with ρma 2.65 (sandstone), 2.71 (limestone) and 2.876 g/cc (dolomite), ρf 1.0 g/cc, and the neutron taken as φ in the matrix's own units. The library draws what it is handed. Each is drawn in ink at stroke-edge over the points, cased in card, and told apart by its pattern (solid, dashed, dotted); a point of size-point in ink marks every 0.05 of porosity, the marks the host gives. Each is named at its end in value in ink, the names pushed apart to space-label with a hairline leader in base where one has moved.
  • Outside the axes: a point outside either axis is not drawn and is counted, never dropped silently.
  • Measurements: the points, of the samples, with those with a NULL said; the points outside the axes; and what colours them, with its range ("gamma ray, 17 to 198 API").
  • Options: xLog, yLog, yReversed and density. density is for many points: counts in cells of size-count-cell, inked on count-1 to count-5 as the Persistence draws them, the third series then not drawn; drawn as points a cross-plot holds at most 500,000, past which it refuses in words naming the count and the way out.
  • Don't: draw a line the host did not hand in, take the sample's three lines for the library's, or drop a point outside the axes without counting it.
Retention by cohort: the heatmap chart, drawn by Hue Charts from its own sample.

Heatmap

Cells on the sequential scale, their words by the rule, the scale key

Guidelines

A heatmap shows where a measure is high across two categories, each cell's lightness its value.

  • Provide: the rows, the columns and each cell's value; an empty cell is a value not yet reached or not known.
  • Cells: seq-1 (near the ground) to seq-5 (far from it) by value, rounded radius-cell, space-part apart with the card between them. A cell whose lightness is its value carries no lit edge. An empty cell is a hairline outline in grid, and the notes say what empty means.
  • Words: a cell's value on it under the rule for words on a mark: on the light ground seq-3 to seq-5 take card, on the dark ground seq-1 to seq-3 take ink.
  • The key: the scale's ramp, size-key-ramp wide, its ends' values in label.
  • Options: dots sized by value in place of cells; weekday by hour read from dates (the punch card).
  • Don't: use the series inks for a scale, or a diverging scale for a measure with no natural middle.
Commits by hour and day: the punch card chart, drawn by Hue Charts from its own sample.

PunchCard

Dots by the hour and the day, each dot's area its count

Guidelines

A punch card shows when things happen: each hour of each weekday a dot whose area is its count.

  • Provide: instants (ISO 8601 text with their time), each counted once or by its weight, which the chart bins by weekday and hour in the zone; or cells, each a weekday, an hour from 0 to 23 and its value. A day with no time is refused. Say the counts' unit.
  • Dots: seven rows of weekdays by twenty-four columns of hours, a dot in series one at each hour, its area its count: the radius goes by the square root of the count over the largest, the largest a pixel clear of its cell's nearer edges, and a count above naught is never under 0.75 px of radius. An hour of naught, or none given, stays empty. A cell needs 6 px each way; a card too small for that is refused, naming the size that holds it.
  • Words: the hours along the top in label, every k-th, the least k that holds each a clear space from the next: "00" to "23" by a 24-hour clock, "9 am" by a 12-hour one. The weekdays down the lead in label, Monday first.
  • Notes: one line on the picture, how the hours were binned: "binned by the hour by this device's clock (Europe/London)", "binned by the hour in" a zone where one is given, or "the hours as given" for cells. That each dot's area is its count, and the largest count, is carried whole beside the picture.
  • Options: mark, dot or tint: under tint each hour is a cell on seq-1 to seq-5, with the scale's key under the grid, and values writes each count on its cell. clock, 24-hour or 12-hour. weekStart, Monday, Sunday or Saturday. zone, an IANA name, else the device's.
  • Don't: size a dot by its radius, or draw an hour with no count as a dot.
Cohorts by age and spend: the scatter chart, drawn by Hue Charts from its own sample.

Scatter

Points ringed in the card, each group named at its centre

Guidelines

A scatter shows whether two measures move together, each thing a point, its groups told apart.

  • Provide: each point's two values and, where there are groups, its group; a third value sizes the points (bubbles).
  • Marks: points size-scatter, filled in their group's ink and ringed 1 px in card, so a crowd still shows each point; both grids, hairlines in grid.
  • Names: each group named at its points' centre on a plate of the card, in its series-k-of-m-text, laid over every group's points; the names are the groups' switches, so a scatter has no chips.
  • Axes: say which measure runs across and which up in the context, with their units.
  • Don't: join the points with a line, or start the scales at zero when the values sit far from it.
Antenna input match: the Smith chart, drawn by Hue Charts from its own sample.

Smith

An antenna's S11 over its sweep on the impedance plane, with markers and a VSWR circle

Guidelines

A Smith chart draws an antenna's reflection coefficient across a frequency sweep on the impedance plane, so where the match is good and at what impedance stand out: the trace's distance from the centre is the mismatch, and the grid under it reads the impedance.

  • Provide: the sweep as a Touchstone file carries it: its frequencies, rising, in hertz at any prefix; S11 at each, as the file's option line gives it (real and imaginary, magnitude and angle, or decibels and angle); and the reference impedance in ohms the option line names (50 by default). A file of more ports gives its S11, and the chart says the rest are left out. The host's markers, each a frequency in the sweep with its name; the VSWR the circle stands at (2 by default).
  • The grid: the circles of constant resistance at 0.2, 0.5, 1, 2 and 5 and the arcs of constant reactance at ±0.2, ±0.5, ±1, ±2 and ±5, in units of the reference impedance, each a hairline in grid, the unity circle and the ±1 arcs in grid-major. The real axis and the unit circle, where the resistance is naught and S11 as large as it can be, in base. Resistances are named along the real axis in label on a plate of card, reactances round the rim outside the circle in label, signed ("+0.5", "−2"). A resistance word the trace would meet moves to the real axis's other side, else is left out and counted, the table naming the grid.
  • The trace: S11 from the first frequency to the last, in series one at stroke-line, straight from point to point, its last point ringed in card (size-point). It stands inside the unit circle for a passive antenna; a row outside it is drawn where it falls, and the foot counts such rows.
  • The VSWR circle: the circle of S11's magnitude at the VSWR given, a dashed hairline in ink round the centre, its radius (VSWR − 1) / (VSWR + 1) of the unit circle's, named on itself in value on a plate of card ("VSWR 2"). It meets the real axis at the resistance equal to the VSWR and at its inverse. The trace inside it is the band at or under that VSWR.
  • Markers: each a disc of size-scatter in ink, ringed in card, on the trace at its frequency. Its words stand in a column to the right of the chart, centred on it, each two lines tall and in the order the markers stand from the top: the frequency in value in ink ("2.45 GHz") over the impedance in label ("55 + j9 Ω"), a hairline in ink from the marker to its words. The impedance is the reference times (1 + S11) over (1 − S11), its real part and its reactance rounded to a whole ohm, the reactance's sign said by "+" or "−".
  • Axes: the reflection coefficient's real part across and its imaginary part up, each from −1 to 1, the plane the grid stands on. No tick of its own is drawn: the grid's words are its scale, and the context line says the sweep and the reference ("2.20 to 2.70 GHz · normalised to 50 Ω").
  • Measurements: the best match, the frequency of the least S11 magnitude in the sweep; its return loss in dB, −20 log10 of that magnitude; its VSWR, (1 + magnitude) / (1 − magnitude); and the bandwidth at the circle's VSWR, the run of consecutive rows at or inside the circle that holds the best match, its width in MHz with its edges in GHz, each edge where the magnitude crosses the circle's on the straight line between two rows.
  • Options: reference (the reference impedance in ohms, else port one's), vswr, bandwidthAt (a VSWR, or none), resistances and reactances (the grid's values). The markers (each a frequency and its name) are the data's.
  • Don't: name an impedance against any reference but the file's: the grid in units and the markers in ohms are one reference, the option line's. Nor draw the trace as a curve: a smooth line passes through impedances no row measured.

Anatomy

Sales by region: the column chart, drawn by Hue Charts from its own sample.

Card

Header, plot, chips, foot; wide and narrow

Guidelines

The Hue card: every chart sits in one, so a page of them reads as one product.

  • Provide: a title (sentence case, one line), the context line (the unit and the period), and where you want one the figure (as text, or a rule the chart answers: last, total, share) with its delta against the period before; the data; the source line.
  • Regions, top to bottom: the header (title and context | figure and delta chip), the plot (value ticks on its left, names on its right), the key and the chips, the foot (notes, then the source). A region the chart leaves empty collapses.
  • Size: the plot is laid out to the card's width, never scaled, so its words stay at their size. Below 400 px the card takes space-card-narrow and the figure headline-narrow.
  • Card or none: card on (the default) or off, the same anatomy with no surface, outline or shadow, where the host's container is already a card (Power BI's default).
  • Do: say in the notes what tells the series apart when it is their place, as here. Don't: add a figure nobody asked for, or set a word outside its region.

Labels

Sales by region: the column chart, drawn by Hue Charts from its own sample.

Chips

On, hidden and focused; press one to switch its series

Guidelines

Chips name the series where the chart has no room to name them at their marks, and switch them.

  • When: grouped columns, a donut's small parts. A chart that names its series at their marks (lines, areas, stacks, a scatter's groups, a treemap's groups, a Gantt's phases) has no chips: the names are the switches. A chart of one series has neither.
  • Look: size-chip tall (above WCAG 2.2's 24 px target), chip-text in ink on chip, a size-chip-dot dot in the series ink, radius-chip, space-chip apart, one row under the plot, wrapping, in the series' order.
  • Hidden: pressed, the series hides; its dot turns hollow in faint and its words muted, and it stays where it was. Pressing it again brings the series back.
  • Focus: a stroke-focus ring in ink, 2 px off the chip. Pressed: ink at opacity-pressed behind it.
  • Don't: reorder the chips when a series hides, or use chips to explain what marks mean: that is the key.
Sales by region: the column chart, drawn by Hue Charts from its own sample.

Delta

Up and down, the sign in the words

Guidelines

The delta chip says how the card's figure changed against the period before, beside the figure.

  • Provide: the change and what it is against ("on Q3", "on FY25", "day on day"); it is drawn only where the host asks for it and the data has a period before.
  • Look: value words in rise-text on rise-tint when up and fall-text on fall-tint when down, both solved to 4.5:1 on their tint; size-chip tall, radius-chip, space-chip-x at its ends.
  • The sign is in the words ("+5.3 %", "−3.2 %", with the minus sign), so the colour is never the only cue.
  • Don't: show a delta without what it is against, or colour it by whether the change is good: up is rise even when up is bad (costs), and the words say which.
Revenue bridge: the waterfall chart, drawn by Hue Charts from its own sample.

Key

What marks mean, and a scale's ramp

Guidelines

The key explains what marks or a scale mean; it never names series a reader can switch off.

  • Marks: items set like chips but not pressable, with no pill behind them: a 10 px mark in the ink it explains, then its meaning in chip-text. A hollow mark is its ink's outline at stroke-edge; a tick is a stroke-focus stroke.
  • A scale: a ramp size-key-ramp wide and 8 px tall of seq-1 to seq-5, rounded radius-cell, its ends' values in label.
  • Where: in the chips' row under the plot. A waterfall's increase, decrease and total; a candle's up and down; a bullet's measure, target and bands; a heatmap's or a calendar's scale.
  • Don't: use a key for series: name them at their marks, or in chips.

Part of a whole

Traffic by channel: the donut chart, drawn by Hue Charts from its own sample.

Donut

Gaps, the whole in the centre, parts named where they have room

Guidelines

A donut shows the parts of one whole, largest first, with the whole in its centre.

  • Provide: the parts and their values (at most about seven; gather the smallest as "Other"), and the word for what the whole counts.
  • Marks: the hole size-hole of the radius; slices clockwise from twelve o'clock, space-part apart with the card between them, square at their corners in either shape, each lit along its outer arc.
  • Names: a part is named on its slice, its share under its name, where both fit the arc and the ring; the words take the rule for words on a mark, so a slice whose ink neither ground reaches 4.5:1 on carries a plate. Parts with no room are named in chips with their share.
  • The centre: the whole in headline, what it counts in label.
  • Don't: start anywhere but twelve o'clock, explode a slice, or use a donut for parts that do not make a whole.
Sign-up funnel: the funnel chart, drawn by Hue Charts from its own sample.

Funnel

Stages across, each step's rate in words

Guidelines

A funnel shows how many reach each stage of a process, and the share each stage keeps of the one before.

  • Provide: the stages in order with their counts; the figure, where asked for, is the first stage to the last.
  • Marks: one bar a stage, across from a common start, its far end rounded and lit; the stage names in the lead column in label, each count at its bar's end in value.
  • Rates: each stage's share of the one before stands on the right in value, muted, and the notes say what it is.
  • Don't: centre the bars into a funnel's outline, which hides the common start the counts are read from.
Revenue by product: the treemap chart, drawn by Hue Charts from its own sample.

Treemap

Squarified tiles, each group a named block, parts named where they fit

Guidelines

A treemap shows the parts of a whole as tiles whose areas are their values, grouped and coloured by group.

  • Provide: the parts with their values and, where they fall into groups, each part's group.
  • Marks: squarified tiles, largest first, space-part apart with the card between them, rounded radius-tile and lit along their tops; a tile takes its group's ink.
  • Groups: each group laid out whole in a block of its own, largest first, and named along the block's top in its series-k-of-m-text, so its place and its name tell it apart as well as its ink. The name is the group's switch, so a treemap has no chips.
  • Names: a tile is named, its value under its name, where both fit it, under the rule for words on a mark: one plate under both where neither ground's ink reaches 4.5:1 on the tile. A tile with no room is named in the tooltip.
  • Don't: colour tiles by value as well as by group, or nest more than one level in one picture.

States

Motion

Enter and a change of data, on the motion tokens; press to replay

Guidelines

Motion: marks enter by growing from the baseline, and a change of data eases from the old values to the new.

  • Enter: columns and areas grow from the baseline, lines draw left to right, a donut sweeps, over duration-enter on easing-enter (Material 3's emphasized decelerate); categories start duration-stagger apart, 200 ms at most in all.
  • A change of data: each mark eases from its old value to its new over duration-morph on easing-morph; it never re-enters.
  • Reduced motion: where the reader asks for it, nothing moves; the picture is drawn at its end.
  • Files (PNG, PDF) are the last frame. The element and Power BI move; nothing else does.
  • Don't: animate on scroll, loop, or move anything the reader did not change.

States

Focus, empty and refused

Guidelines

The states a chart can be in besides its plain picture: focused, empty and refused (hover is the Tooltip's).

  • Focus: a ring in ink at stroke-focus, 2 px off the focused mark and following its shape; the arrow keys move it from datum to datum, and the tooltip shows as on hover.
  • Pressed: a chip or a name at opacity-pressed of ink behind it for the press. Hidden: as the Chips say.
  • Empty: the card keeps its header and says "No data for this view" in the plot's centre, in note; the context says which view.
  • Refused: where the plot has no room to draw, its region collapses and the foot names the size it needs and the size it has. A chart never draws itself smaller than it can be read.
  • Don't: draw an empty axis for empty data, or shrink the words to fit a small space.

Tooltip

Hover or focus a column: its series stays, the rest dim, the tooltip lists all

Guidelines

The tooltip card shows a category's values on hover and on keyboard focus alike, while the rest of the chart dims.

  • The state: the series under the pointer or the focus stays and every other mark goes to opacity-dim, easing over duration-morph on easing-morph (none when the reader asks for reduced motion).
  • The card: card surface, a line outline, radius-tooltip, shadow-tooltip; the category in value, then every series' value in drawn order, each with its dot, the hovered series' row in ink and the rest muted.
  • Place: beside the mark, on the side with room, never under the pointer. It stays while the pointer is over it and Escape dismisses it (WCAG 1.4.13); the arrow keys move from datum to datum.
  • Don't: show only the hovered series' value, or put a value in the tooltip the data table does not have.

Colour

Revenue and cost: the line chart, drawn by Hue Charts from its own sample.

Series

The series from the default seed, ring by ring, by the kernel's law

Guidelines

Series: the colours the kernel's law draws from the default seed, ring by ring, on this ground.

  • The law: series one is the seed's hue at every series count; series two onward stand at their seats on the ring that serves the count (themeOf, seatOf, ink), at lightness 0.56 on the light ground and 0.72 on the dark. The ring holds a pair of seats for every two series, so a chart of one to four series takes the first n of the ring of four, five or six the ring of six, seven or eight the ring of eight. Each column is drawn in tokens scripts/inks.ts wrote from the kernel, with its lit edge.
  • The seed is the Hue mark's zero point, #8b42f0. A host's brand colour replaces it, matched exactly; the compliance solve moves it only to hold 3:1, and says what it moved.
  • Don't: pick a series colour by hand, take a colour from a ring the chart's count does not use, or reorder the series.