PixelOftype | { a; lo; k } | An axis's mapping taken apart once: a value v stands at pixel a + (v − lo)·k of the plot. |
|---|
pointCountsfunction | pointCounts(groups, x: PixelOf, y: PixelOf, w: number, h: number, cells?: number): { counts; regions } | Points counted into the pixel under each, by group, and into a grid of regions over the plot; scatter's density reads them. |
|---|
COUNT_TOPconstant | COUNT_TOP: 4294967295 | The top a density's count holds at, 2³² − 1: it is never wrapped. |
|---|
rowsAtfunction | rowsAt(samples, first: number, rate: number, columns: number, timeAt, rowOf): Float64Array | The row an acquisition falls in at each column's middle, its value a sample's own where the middle lies on one, else on the line between the samples either side; none past its samples or where a sample it reads is a gap. |
|---|
CountGridclass | new CountGrid(columns, rows) | Acquisitions counted into cells, allocated once: each marks every cell from the last column's row to this one's, once; a count held at its top, the cells held there counted. One counted out by the rows it was added by, where no cell is held. |
|---|
countStepsfunction | countSteps(d?: number): [number, number, number, number] | The least count of count-2 to count-5: 2, then the whole decades that part those under the top most evenly, then ten to the top decade d (3 by default: 2, 10, 100, 1,000). |
|---|
countStepfunction | countStep(n: number, steps: [number, number, number, number]): number | A count's step by the steps' least counts: 0 for count-1 to 4 for count-5, −1 for no count. |
|---|
BIGconstant | 4000 | Past this many points a series stops drawing a marker, a value label and a region per point. |
|---|
m4function | m4(n, xAt, v): number[] | M4 aggregation: of the points in each pixel column keep the first, last, lowest and highest; the line through them shows every column's exact range. |
|---|
densityfunction | density(data, x, y, box, theme, cells?): { w; h; rgba; top; regions } | Many points as a density, counted per pixel: each pixel the group with the most points there, its hue and trace at the renderer's lightness for its count on a log scale, opaque and never a mix of groups; exact and deterministic, and the regions of a cells × cells grid counted for the pointer. |
|---|
bigSeriesfunction | bigSeries(n, seed?): number[] | A long seeded random walk, for trying a line with millions of points. |
|---|
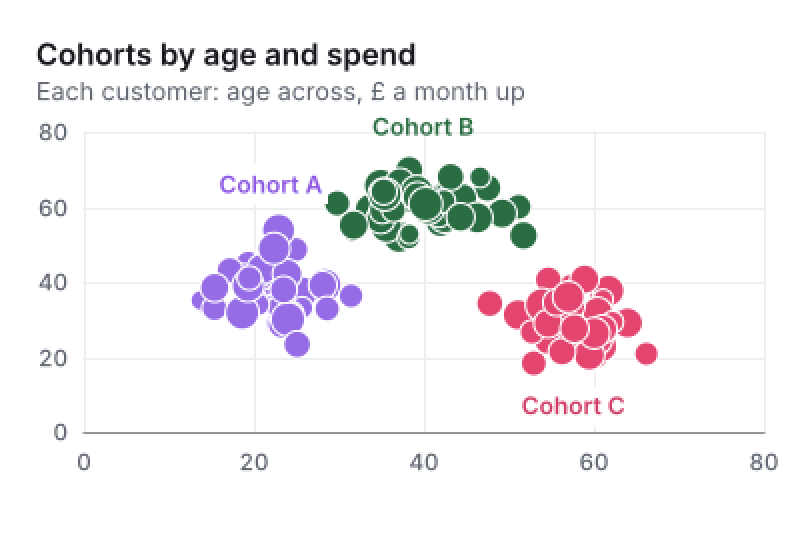
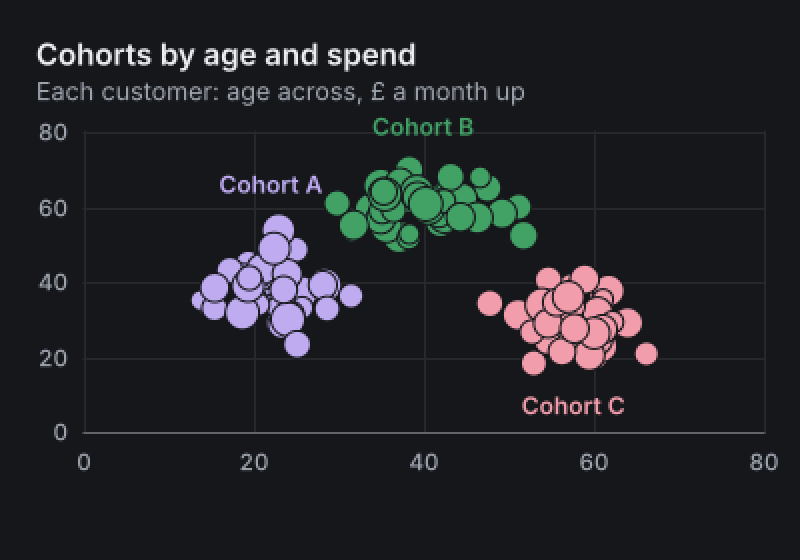
bigScatterfunction | bigScatter(n, seed?): ScatterData | A large seeded point cloud in three groups. |
|---|
VIEWconstant | readonly OptionDef[] | The view options a zoomable chart declares: from and to, the window of the data shown. |
|---|
Extremesclass | new Extremes(values[, { sums }]) | A series' extremes: the least and greatest of any range in logarithmic time, from blocks of 64 and their pairs, so M4 over any zoom window stays real-time; with `sums`, each block keeps its sum and sum of squares, so a range's mean and RMS come back in the same time. |
|---|
TriggerKindtype | "edge" | "glitch" | "runt" | "window" | The software triggers: an edge through a level; a glitch, a pulse narrower than a width; a runt, a pulse that does not reach its upper level; a window, a sample leaving [level, upper]. |
|---|
TRIGGER_KINDSconstant | readonly TriggerKind[] | The trigger kinds, in the order the controls row offers them. |
|---|
TriggerSettingtype | { kind: TriggerKind; level: number; upper?: number; slope?: "rising" | "falling"; polarity?: "positive" | "negative"; width?: number } | A trigger's setting, its levels in the values the samples are given in, a glitch's width in samples. |
|---|
TriggerStatetype | { phase: "armed" | "single" | "held"; next: number; last?: number; opened?: number; reached?: true } | Where a trigger stands: armed (Run), single (one moment, then held) or held; the place of the next sample, and what it carries from the samples before. |
|---|
triggerAtfunction | triggerAt(phase: TriggerState["phase"], next?: number): TriggerState | A trigger set going at a place in the record, nothing carried from before it. |
|---|
rearmedfunction | rearmed(s: TriggerState, phase?: TriggerState["phase"]): TriggerState | A trigger set going again where it stands, armed or single, or with a new setting: its place and last sample kept, no pulse carried. |
|---|
triggeredfunction | triggered(samples: ArrayLike<number>, setting: TriggerSetting, state: TriggerState): { state: TriggerState; found: readonly number[] } | The moments a software trigger finds in the samples that arrived, each a place in the record on the line between two samples, and its state after them: samples in any pieces find what the whole finds. |
|---|
Waveformtype | { name: string; unit?: string; rate: number; start?: number; clock?: string; scale?: number; offset?: number; samples?: ArrayLike<number>; byRange?: ByRange; gaps?: WaveGap[]; made?: Making; prefiltering?: string } | A series sampled at a steady rate: its rate in samples a second, its start and clock time, its samples held in the type they were written in with the scale and offset that make them physical, or the host's, fetched by range; where its record breaks, its gaps; how it is made from others where it is made by range; and the filtering its recorder applied, as its file says it. |
|---|
Makingtype | { from: Waveform[]; lead: number; key: string; maker(): (from: readonly Float64Array[]) => Float64Array } | How a waveform is made from others place by place (a montage's row, a row through its filters): its sources at one rate, start and gaps, the places before a place a run reads (a filter's warm-up), its key, and a maker of its runs, made afresh at rest at a run's start and after each gap. |
|---|
Passedtype | { key: string; extremes: Extremes } | The extremes a pass over a record built of a waveform made from the one that carries them, named by its making's key. |
|---|
WaveGaptype | { before: number; seconds: number } | A break in a waveform's record (a discontinuous EDF+ record's): the place of the sample it stands before, and the seconds it lasts. No sample stands in a gap, and a line is not drawn across one. |
|---|
ByRangetype | { length: number; extremes?: Extremes; held?: { first: number; samples: ArrayLike<number> }; range(first: number, last: number): Promise<ArrayLike<number>>; passes?: Passed[] } | A waveform the host keeps: its length, its extremes built as its file streamed (a waveform made from others has them once a pass has built them), the samples held now, how to fetch more, and the passes the door carries for the waveforms made from it. |
|---|
WaveformRefusedclass | class WaveformRefused extends RangeError | A waveform the library cannot read, named with what is wrong: no rate, both samples and a range or neither, a scale of naught. |
|---|
GainUnitRefusedclass | class GainUnitRefused extends WaveformRefused | An ECG whose leads are in no unit of volts, so its gain in mm a millivolt has no unit to read; a host that takes a unit from its measure's format string says where to set it. |
|---|
DecoderRefusedclass | class DecoderRefused extends RangeError { field: string; at: string } | A file a decoder cannot read, refused by name: the field, its place in the file ("byte 184", "record 37"), and why. |
|---|
EdfSignaltype | { label; transducer; unit; physical: [number, number]; digital: [number, number]; prefiltering; perRecord } | A signal as an EDF header gives it: its label, transducer, physical dimension, physical and digital ranges, prefiltering and samples a record. |
|---|
| type | { form: "EDF" | "EDF+C" | "EDF+D"; patient; recording; clock; headerBytes; records; recordSeconds; signals: EdfSignal[] } | An EDF header as read: its form, the patient and recording fields, its start as an ISO 8601 clock (EDF+'s whole year, else 1985 to 2084), its length, its records and their seconds, and its signals. |
|---|
EdfAnnotationtype | { at: number; words: string; duration?: number } | An EDF+ annotation: its onset in seconds from the file's start time, its duration where it gives one, and its words; a strip chart takes it as an event. |
|---|
EdfDecodedtype | { header: EdfHeader; waveforms: Waveform[]; annotations: EdfAnnotation[]; said: string[] } | An EDF file decoded: its header, its ordinary signals as waveforms, held or by range, its annotations, and what the reading says of it. |
|---|
EDF_ANNOTATIONSconstant | "EDF Annotations" | The label of EDF+'s annotations signal. |
|---|
| function | edfHeader(bytes: Uint8Array): EdfHeader | An EDF file's header read, or refused by name: its version, its length against its signals, its counts, start, and each signal's fields. |
|---|
edfDecodedfunction | edfDecoded(bytes: Uint8Array): EdfDecoded | An EDF or EDF+ file decoded from its bytes, with no request: each ordinary signal a waveform held in its 16-bit samples with the scale and offset that make them physical (a negative gain read as one), its rate, its first record's start and the file's clock, a discontinuous record's breaks its gaps; EDF+'s annotations; refused by name where its records do not fit the file, it holds no whole record, a signal has no samples, or a record's time breaks EDF+C's continuity or starts before EDF+D's record before it ends. |
|---|
ByteReadertype | (from: number, length: number) => Promise<Uint8Array> | The host's file read again, for a decoder reading a file too large to hold: the bytes from a place, answered later. |
|---|
EdfStreamclass | new EdfStream(read: ByteReader) { push(chunk: Uint8Array): void; done(): EdfDecoded } | An EDF or EDF+ file too large to hold, read as it streams, with no request: the host pushes its bytes in order, a chunk at a time (the same buffer refilled if it likes); done gives each ordinary signal a waveform by range, its extremes and their sums built in the one pass, whose range reads the records holding the samples asked through the host's reader. Refused by name as edfDecoded refuses. |
|---|
TdmsValuetype | number | string | boolean | A TDMS property's value: a number (a 64-bit integer as the nearest), words, a truth, or a time as ISO 8601 in UTC. |
|---|
TdmsGrouptype | { name: string; properties: Record<string, TdmsValue>; waveforms: Waveform[] } | A TDMS file's group: its name, its properties, and its channels that are waveforms at a steady rate. |
|---|
TdmsDecodedtype | { version: number; properties: Record<string, TdmsValue>; groups: TdmsGroup[]; said: string[] } | A TDMS file decoded: the version its first segment writes, its properties, its groups in the order first written, and what the reading says of it. |
|---|
tdmsDecodedfunction | tdmsDecoded(bytes: Uint8Array): TdmsDecoded | NI's TDMS decoded from its bytes as NI's description of its internal structure gives it, with no request: segment by segment, little- or big-endian, contiguous or interleaved, its metadata in full, the one before or none; each channel of a numeric type with wf_increment a waveform held in its own type, its unit, timing and linear scales its properties'; what is no waveform left out and said; refused by name where a tag, version, offset, chunk, data type or scale cannot be read, and for DAQmx raw data. |
|---|
TdmsStreamclass | new TdmsStream(read: ByteReader) { push(chunk: Uint8Array): void; done(): TdmsDecoded } | A TDMS file too large to hold, read as it streams, with no request: the host pushes its bytes in order, a chunk at a time (the same buffer refilled if it likes); done gives each numeric channel with wf_increment a waveform by range, its extremes and their sums built in the one pass, whose range reads the bytes from the first value asked to the last through the host's reader. Refused by name as tdmsDecoded refuses. |
|---|
Wanttype | { waveform: Waveform; first: number; last: number } | What a draw of a waveform fetched by range wants and has not: the samples of its view, naming the very waveform its data holds. |
|---|
WaveTracetype | { at: Float64Array; v: Float64Array; fromBlocks: number; wants?: Want; breaks?: number[] } | A waveform's view as a line draws it across pixel columns: its points in order, each a place in samples and a physical value, how many columns were drawn from blocks, what the view wants, and where a gap breaks it, each later run's first point. |
|---|
tracePiecesfunction | tracePieces<T>(trace: WaveTrace, points: T[]): T[][] | A trace's points cut into the runs its gaps leave, each drawn alone, so no line crosses a gap. |
|---|
waveTracefunction | waveTrace(w: Waveform, first: number, last: number, cols: number): WaveTrace | A waveform's view across pixel columns: each column's first, least, greatest and last, or every sample under four; columns on blocks' edges where it is fetched by range and holds a block a column; under a block a column and not held, each column its block's least to greatest and the view wanted; where gaps break the view, each run traced alone across its share of the columns. |
|---|
LineDatatype | UnitSeriesData | WaveformsData | What the Line draws: categories and their series, or waveforms, the capture. |
|---|
WaveformsDatatype | { waveforms: Waveform[]; trigger?: CaptureTrigger } | The Line given waveforms: one line each on one time axis, all in one unit, and the trigger where one was found. |
|---|
CaptureTriggertype | { at: number; level?: number } | Where a capture's trigger was found, in seconds from the record's start, and the level it crossed in the waveforms' unit: its mark at the plot's top, its level dashed with a T at its end, and with the around option a second pane of its neighbourhood sample by sample. |
|---|
captureSamplefunction | captureSample(): WaveformsData | The capture's sample, made once: a motor's phase current, 1 s at 1 MS/s with its switching ripple and a transient ringing at 25 kHz, triggered where the software trigger finds the edge through 15 A. |
|---|
placesWithinfunction | placesWithin(w: Waveform, t0: number, t1: number): readonly [number, number] | undefined | The first and last places of a waveform's samples within a span of seconds, a sample's own time read as its own place however its double rounds, its gaps stepped over; none where it holds none, a gap among them. |
|---|
placeFromfunction | placeFrom(w: Waveform, t: number): number | The place of a waveform's first sample at or after a time, within its samples: in a gap, the first after it. |
|---|
samplesHerefunction | samplesHere(w: Waveform, a: number, b: number): ((i: number) => number) | undefined | A reader of a waveform's stored samples over a range where they are here, held or among its held samples; none where they are the host's. |
|---|
extentOverfunction | extentOver(w: Waveform, a: number, b: number): Extent | A waveform's extent over a range of its samples in physical values; by range and not here, over the whole blocks that hold them. |
|---|
valueAtfunction | valueAt(w: Waveform, t: number): { v: number } | { want: Want } | { gap: true } | A waveform's physical value at a time, on the straight line between the samples either side; where they are not here, the two samples wanted to read it; in a gap, none. |
|---|
StripDatatype | { rows: StripRow[]; groups?: string[]; events?: StripEvent[]; calipers?: StripCaliper[]; marks?: StripMark[] } | The Strip chart's data: its rows top to foot, where they stand in groups each group's name, the record's events, the calipers placed on its rows and a host's marks. |
|---|
StripRowtype | { name: string; waveform?: Waveform; segments?: StripSegment[]; group?: number; scale?: number } | A strip chart's row: one waveform for the whole span, or segments; its group; and where it takes its own scale, the value its height holds, said beside its name. |
|---|
StripSegmenttype | { name: string; waveform: Waveform; from: number; to: number; keys?: string[] } | A stretch of a strip chart's row: a waveform over [from, to] seconds of the record, named at its start inside the row, a mark where it changes; and, where the waveform was read from a table, the row key of each of its samples, which the stretch's regions name the rows they draw by. |
|---|
StripEventtype | { at: number; words: string; duration?: number } | An event of a strip chart's record: a moment, or a span where it lasts, in seconds from the record's start, and its words, flagged at the plot's top. |
|---|
StripCalipertype | { name: string; from: number; to: number; row?: number } | A caliper on a strip chart's row, in seconds from the record's start: alone on its row, its bracket at its handles' height and its interval on a plate; several on one row, each in a lane under the plot with its guides. |
|---|
StripMarktype | { row: number; at: number; words?: string } | A host's mark on a row: a moment a caliper's end snaps to within size-hit, its words named over the row where it has them. |
|---|
StripMoretype | { said?: string[]; measurements?: Measurement[]; rate?: string; scaleSaid?: string } | What a preset adds to the strip chart it draws on: its data's maker's words, its measurements in place of the strip's own, the words a caliper's rate is said in, and its values' scale in the context line. |
|---|
STRIP_OWNconstant | readonly OptionDef[] | The strip chart's options past its view: rows from, scale, cursor, polarity, the high-pass, low-pass and notch, speed, sensitivity, the screen's pixels a millimetre, the clock along the foot, the grid's lines (the ticks, each second, the mm grid), what a row's baseline stands for and the calibration pulse; its presets take theirs from it. |
|---|
STRIP_OPTIONSconstant | readonly OptionDef[] | The Strip chart's options: its header, its axes, its view and its own (STRIP_OWN). |
|---|
heldStripfunction | heldStrip(d: StripData): void | A strip chart's data held, or refused by name: one row or more, each a waveform or segments, groups and scales in range, the rows on one scale in one unit, each event at a time with words. |
|---|
heldEventsfunction | heldEvents(events: StripEvent[]): void | A record's events held, or refused by name: each at a time, with words, lasting naught or more where it lasts. |
|---|
stripDrawnfunction | stripDrawn(d: StripData, o: Options, t: Look, size: Size, more?: StripMore): Drawn | The Strip chart drawn, with what a preset adds: its words said, its measurements, its calipers' rate and its scale's words. |
|---|
stripChartconstant | ChartDef<StripData> | The Strip chart: one time axis, a row a waveform on its own baseline standing for its mean, through its display filters and negative up where asked, every row at one scale said in the key as a bar, or at a physical scale its speed and sensitivity, the bar and the time together; the clock along the foot, events flagged, the cursor's value on each row in the end column, the overview past the rows that fit; it keeps time. |
|---|
stripSamplefunction | stripSample(): StripData | The Strip chart's sample, made once: a gearbox rig's 16 accelerometers on three axes, a second at 25.6 kHz, one carrying an outer-race bearing fault. |
|---|
EegDatatype | { electrodes: Waveform[]; events?: StripEvent[]; montage?: Montage } | An EEG's data: a record's held electrodes named as its recorder labels them, its events, and the host's own montage where it gives one. |
|---|
heldEegfunction | heldEeg(d: EegData): void | An EEG's data held, or refused by name: one electrode or more, each readable, its events, and a host's montage of chains of rows each two names. |
|---|
eegDrawnfunction | eegDrawn(d: EegData, o: Options, t: Look, size: Size): Drawn | The EEG drawn: its montage's rows on the strip chart, its sensitivity in µV a millimetre read into the rows' unit, the rows left out said. |
|---|
eegChartconstant | ChartDef<EegData> | The EEG, the strip chart's preset: the record in a montage, each chain a group, at 30 mm/s and 7 µV/mm on the physical scale, negative up, through 1–70 Hz and a 50 Hz notch, a line each second, events flagged, its clock along the foot. |
|---|
eegSamplefunction | eegSample(): EegData | The EEG's sample, made once: a routine record's 19 electrodes, 10 s at 256 Hz from 14:02:10, alpha at the back while the eyes are closed, blinks at the front, mains on two poor contacts. |
|---|
ECG_LEADSconstant | readonly ["I", "II", "III", "aVR", "aVL", "aVF", "V1", "V2", "V3", "V4", "V5", "V6"] | The twelve leads, in the order a record keeps them. |
|---|
ECG_LAYOUTSconstant | readonly ["3×4 with a rhythm strip", "6×2", "12×1", "one lead"] | The layouts the ECG lays its leads out in. |
|---|
EcgCalipertype | { name: string; from: number; to: number } | A caliper a reader or the host placed, in seconds from the record's start: it stands on the rhythm strip. |
|---|
EcgMarktype | { lead: string; at: number; words?: string } | A host's mark on a lead: a moment a caliper's end snaps to, and its words over the lead where it has them. |
|---|
EcgDatatype | { leads: Waveform[]; keys?: string[][]; measures?: Measurement[]; calipers?: EcgCaliper[]; marks?: EcgMark[] } | An ECG's data: a record's held leads named as its recorder labels them, the row key of each of their samples as the table they were read from names it (a list to each lead), the host's measures, the calipers placed and the host's marks. |
|---|
heldEcgfunction | heldEcg(d: EcgData): void | An ECG's data held, or refused by name: one lead or more, each readable, each caliper's ends apart, each mark at a time. |
|---|
ecgDrawnfunction | ecgDrawn(d: EcgData, o: Options, t: Look, size: Size): Drawn | The ECG drawn: its layout's rows of segments at its speed and gain on the mm grid, each row opening on its pulse from naught; the calipers on the rhythm strip, the marks on the leads that show them, the leads the record lacks said. |
|---|
ecgChartconstant | ChartDef<EcgData> | The ECG, the strip chart's preset: twelve leads at 25 mm/s and 10 mm/mV on the mm grid, three rows of four and lead II along the foot, or six by two, twelve, or one lead; the host's rate the header's figure, its measures and the calipers' the measurements. |
|---|
ecgSamplefunction | ecgSample(): EcgData | The ECG's sample, made once: a resting record's twelve leads, 10 s at 500 Hz in mV, the host's measures and marks, an RR caliper. |
|---|
ecgSampleBeatfunction | ecgSampleBeat(): { from: number; to: number; calipers: EcgCaliper[] } | The sample's measured beat as the one-lead layout shows it: its window as shares of the record, and its PR, QRS and QT calipers. |
|---|
HolterPeriodtype | { from: number; to: number; words: string } | A period the host names over a Holter's day (asleep), in seconds from the record's start, drawn as a band behind the rate. |
|---|
HolterDatatype | { beats: ArrayLike<number>; keys?: string[]; classes?: string[]; normal?: string; periods?: HolterPeriod[]; waveforms?: Waveform[]; clock?: string; duration?: number; recordedTo?: number } | A Holter's data: each beat's time, rising; each beat's row key as the table it was read from names it; its class as the host gives it; the host's periods; the channels for the moment; the record's clock and length; and the seconds recorded so far, while it is being recorded. |
|---|
HolterRatestype | { minutes: number[]; bins: { from; to; rate; least; most }[]; mean: number; least: { rate; minute }; most: { rate; minute } } | A record's minutes and bins rated as DESIGN-SCIENCE §4.13 defines: each minute's beats, each bin's beats over its minutes with its least and most minute, the mean over the minutes recorded. |
|---|
holterRatesfunction | holterRates(beats: ArrayLike<number>, seconds: number, bin: number): HolterRates | A record's rates: each whole minute's beats from its start, each bin of whole minutes, the mean over the seconds recorded, the least and most minute; every beat in those seconds counts. |
|---|
heldHolterfunction | heldHolter(d: HolterData): void | A Holter's data held, or refused by name: beats rising, a class to each where classes are given, periods with words, channels readable. |
|---|
holterDrawnfunction | holterDrawn(d: HolterData, o: Options, t: Look, size: Size): Drawn | The Holter drawn: the day over, its bins' band and rate, its periods and its lanes of beats out of place, the moment a cursor through them; under, the moment's channels at their physical scale, each beat named and each interval in ms; the day alone, saying the height, where the moment cannot stand. |
|---|
holterChartconstant | ChartDef<HolterData> | The Holter: a day of beats in 5-minute bins over the moment at 25 mm/s and 10 mm/mV; the host's classes counted, the mean, least and most rate measured; it classes no beat. |
|---|
holterSamplefunction | holterSample(): HolterData | The Holter's sample, made once: a day of beats from 15:00, asleep from 23:40 to 06:50, ectopic beats among them, two channels at 250 Hz about 03:00. |
|---|
MaskRegiontype | [number, number][] | A region of a persistence picture's mask: its corners in the chart's own units, x then value; the plot cuts it where it runs past. |
|---|
Acquisitiontype | { w: Waveform; at: number; per: number } | An acquisition as persistence counts it: its waveform, held, and the time at + x · per in its record that the picture's x stands for. |
|---|
Persistedtype | { acquisitions: Acquisition[]; x: { lo; hi; unit; what; said }; mask?: MaskRegion[]; before: Measurement[]; after?: Measurement[]; said?: string[] } | What a persistence picture counts, as its chart reads it from its data: the acquisitions, the x's span and words, the mask, the measurements either side of the mask's count. |
|---|
PERSISTENCE_OWNconstant | OptionDef[] | Persistence's own option: the count its darkest step starts at, 1,000 to 1,000,000,000. |
|---|
PERSISTENCE_OPTIONSconstant | OptionDef[] | Persistence's options: the frame's words and axes, and the darkest step's least count. |
|---|
heldAcquisitionsfunction | heldAcquisitions(ws: Waveform[], what?: string): void | Acquisitions as persistence counts them, or refused by name: one or more, each held and of two samples or more, all in one unit. |
|---|
heldMaskfunction | heldMask(mask: MaskRegion[] | undefined): void | A mask held, or refused by name: each region three corners or more, each corner two numbers. |
|---|
persistenceDrawnfunction | persistenceDrawn(a: Persisted, o: Options, t: Look, size: Size): Drawn | A persistence picture drawn: the acquisitions counted into the plot's 2 px cells, each in its count step's ink and keyed as five swatches; the mask over them in chip, the counts inside it drawn again over it and their sum stated; a row of the table a tick interval of the x. |
|---|
PersistenceDatatype | { acquisitions: Waveform[]; mask?: MaskRegion[]; measures?: Measurement[] } | Persistence's data: the acquisitions, each held, timed from its trigger; the host's mask; the host's measures (jitter, rise time). |
|---|
heldPersistencefunction | heldPersistence(d: PersistenceData): void | Persistence's data held, or refused by name: the acquisitions readable, held and in one unit; the mask's regions closed. |
|---|
persistenceChartDrawnfunction | persistenceChartDrawn(d: PersistenceData, o: Options, t: Look, size: Size): Drawn | Persistence drawn: its acquisitions as they stand from their trigger, counted; the acquisitions, the mask's count and the host's measures stated. |
|---|
persistenceSamplefunction | persistenceSample(): PersistenceData | Persistence's sample, made once: a data line's rising edge caught 6,000 times at 40 GS/s, 2 ns either side of the trigger, three runts among them; the host's jitter and rise time. |
|---|
persistenceChartconstant | ChartDef<PersistenceData> | Persistence: every acquisition overlaid at its trigger, each 2 px cell inked by how many cross it, count-1 to count-5 by decade, so one in thousands still shows; a mask the host gives, its count stated. |
|---|
EyeDatatype | { waveform: Waveform; edges?: ArrayLike<number>; unitInterval?: number; first?: number; mask?: MaskRegion[] } | An eye's data: one waveform, held; its clock's edges, or a unit interval and its first edge; the host's mask in unit intervals and the waveform's unit. |
|---|
EyeMeasurestype | { mean: number; top?: number; base?: number; decision?: number; ones: number; zeros: number; height?: { inner; sigma }; width?: number; crossings: number; said: string[] } | An eye's measures as DESIGN-SCIENCE §4.13 defines them: the record's mean, the top, base and decision levels, the ones and zeros, the height in both forms, the width in unit intervals, and why any is left out. |
|---|
EYE_HEIGHTSconstant | readonly ["inner", "3σ"] | The forms an eye's height is stated in: the inner opening the picture shows, by default, or the 3σ form. |
|---|
EYE_OPTIONSconstant | OptionDef[] | The eye's options: persistence's, and the form its height is stated in. |
|---|
eyeFoldsfunction | eyeFolds(d: EyeData): Acquisition[] | The eye's folds: each unit interval whose span from −0.5 to 1.5 of it stands within the record, at a fixed interval or at the clock's own edges. |
|---|
heldEyefunction | heldEye(d: EyeData): void | An eye's data held, or refused by name: its waveform held; its edges rising, or its unit interval above naught, one of the two; a fold whole in the record; its mask closed. |
|---|
eyeMeasuresfunction | eyeMeasures(d: EyeData, folds?: Acquisition[]): EyeMeasures | The eye's measures over its folds: the levels from the centres either side of the record's mean, the decision level their midpoint, the height inner and 3σ, the width from the crossings against their nearest edges. |
|---|
eyeDrawnfunction | eyeDrawn(d: EyeData, o: Options, t: Look, size: Size): Drawn | The eye drawn: its folds counted onto −0.5 to 1.5 unit intervals; its bits, height (inner or 3σ), width and mask count stated. |
|---|
eyeSamplefunction | eyeSample(): EyeData | The eye's sample, made once: a 10 Gb/s link's PRBS7, 4,000 bits through a one-pole channel at 499.5 GS/s, folded at 100 ps, its mask a hexagon and two bars. |
|---|
eyeDiagramChartconstant | ChartDef<EyeData> | The Eye diagram, persistence's preset: a link's bits folded onto two unit intervals and counted, its height, width and mask count measured as DESIGN-SCIENCE §4.13 defines them. |
|---|
TrackedOrdertype | { order: number; label?: string; amplitude: ArrayLike<number>; phase?: ArrayLike<number> } | An order as a tracker gives it: its multiple of the shaft's speed, the order as its table spells it where it was read from one, its amplitude at each of the run's speeds, and its phase there in degrees where tracked. |
|---|
OrderRuntype | { speeds: ArrayLike<number>; keys?: string[]; orders: TrackedOrder[]; unit?: string; measure?: string } | A run as order tracking and Campbell read it: its speeds in rpm, rising or falling; each speed's row key as the table it was read from names it; its orders; the amplitudes' unit, and what they measure. |
|---|
NaturalFrequencytype | { name: string; at: [number, number][] } | A rotor's natural frequency as a host gives it: its name, and its frequency in Hz at speeds in rpm, rising, two or more. |
|---|
Criticaltype | { at: number; speed: number; amplitude: number; band?: { from: number; to: number }; q?: number; said: string[] } | An order's critical speed: its sample, speed and amplitude; its half-power band in rpm and its Q where the run holds both sides, else why not. |
|---|
ORDER_READconstant | OptionDef | The order a chart reads its critical speed from, 1× by default, in halves from 0.5× to 100×. |
|---|
orderNamedfunction | orderNamed(k: number): string | An order's name: its multiple and ×, "1×", "0.5×". |
|---|
criticalNamedfunction | criticalNamed(k: number): string | An order's critical as a chart names it: "First critical" where the order is 1×, else "Critical of 2×". |
|---|
heldRunfunction | heldRun(d: OrderRun): void | A run held, or refused by name: two speeds or more in rpm, each past the one before the same way; one order or more, each named once, its amplitude a size and its phase an angle at every speed. |
|---|
orderReadfunction | orderRead(d: OrderRun, o: Options): TrackedOrder | The order read, by the option: one of the run's orders, refused by name where the run gives none of it. |
|---|
criticalOffunction | criticalOf(speeds: ArrayLike<number>, amplitude: ArrayLike<number>, name: string): Critical | undefined | An order's critical speed over a run's samples, its greatest amplitude's; its half-power band where the amplitude falls to the greatest over √2 either side, each edge on the straight line between its samples; Q the critical over the band's width, unstated where the run ends above that level. None where the order never stands above naught. |
|---|
unwrappedfunction | unwrapped(phase: ArrayLike<number>): Float64Array | A phase unwrapped: each angle moved by whole turns to stand within half a turn of the one before, the first as given. |
|---|
rotorRunfunction | rotorRun(): OrderRun | The sample run, made once: a rotor run up from 300 to 6,000 rpm, tracked every 10 rpm, five orders' velocity in mm/s and phase in degrees through three natural frequencies with a Q of 8. |
|---|
rotorModesfunction | rotorModes(drift?: number): NaturalFrequency[] | The sample rotor's three natural frequencies, from naught to the run's top speed, as its model moves them; the first mode at a share of its own (one where not given), as a bearing warms and cools. |
|---|
orderTrackingDrawnfunction | orderTrackingDrawn(d: OrderRun, o: Options, t: Look, size: Size): Drawn | Order tracking drawn: each order's amplitude against speed named at its end, the order read's phase unwrapped in a pane under it where it stands, the critical down both, its half-power band behind; its critical speed, amplitude, phase and Q stated. |
|---|
orderTrackingSamplefunction | orderTrackingSample(): OrderRun | Order tracking's sample, made once: the sample run's first three orders. |
|---|
orderTrackingChartconstant | ChartDef<OrderRun> | Order tracking, the Line's preset: a run's orders against speed, the order read's phase under them, its critical speed marked through both with its half-power band and Q. |
|---|
CampbellDatatype | OrderRun & { modes?: NaturalFrequency[] } | A Campbell diagram's data: a run as order tracking reads it, and the rotor's natural frequencies the host gives. |
|---|
heldCampbellfunction | heldCampbell(d: CampbellData): void | A Campbell diagram's data held, or refused by name: its run as order tracking holds it; each natural frequency named, at two speeds or more, rising, each above naught in Hz. |
|---|
campbellDrawnfunction | campbellDrawn(d: CampbellData, o: Options, t: Look, size: Size): Drawn | The Campbell diagram drawn: each order's points at their speed and frequency, a point's width apart and sized by amplitude, its line from the origin named at its end; each natural frequency dashed and named; the critical marked and named, read with the most from every sample. |
|---|
campbellSamplefunction | campbellSample(): CampbellData | The Campbell diagram's sample, made once: the sample run's five orders and its rotor's three natural frequencies. |
|---|
campbellChartconstant | ChartDef<CampbellData> | Campbell, the Scatter's preset: a run's orders as points sized by amplitude against its natural frequencies, the order read's critical named as order tracking names it. |
|---|
SPECTRUM_CONTRACTconstant | Contract | A spectrum's contract at the door: its name, its two axes, its values each a number or a gap, its x on a steady grid or at points, every number held. |
|---|
PEAKS_CONTRACTconstant | Contract | A peak list's contract at the door: its name, its two axes, each peak's position and height. |
|---|
SPECTRUM_FIELDSconstant | string | A spectrum's fields as a host or an assistant writes them, said whole in each chart's data type that reads one. |
|---|
PEAKS_FIELDSconstant | string | A peak list's fields, said whole in each chart's data type that reads one. |
|---|
heldSpectrumfunction | heldSpectrum(s: Spectrum, what?: string): void | A spectrum held, or refused by name: its x steady or at points, one of the two, two points or more, a step other than naught, points strictly rising or falling. |
|---|
xOffunction | xOf(s: Spectrum, i: number): number | The x of a spectrum's point: its grid's first plus that many steps, or its point. |
|---|
xsOffunction | xsOf(s: Spectrum): Float64Array | A spectrum's x at every point, in order. |
|---|
heldPeaksfunction | heldPeaks(p: Peaks, what?: string): void | A peak list held, or refused by name: a position and a height each, the positions strictly rising. |
|---|
finiteSamplesfunction | finiteSamples(w: Waveform): void | A waveform's held samples all finite, or refused naming the first that is not; checked once and kept while the samples live. |
|---|
WINDOWSconstant | readonly ["hann", "hamming", "blackman-harris"] | The windows a spectrum is taken under, the periodic forms Heinzel, Rüdiger and Schilling define. |
|---|
WINDOW_LEASTconstant | WINDOW_LEAST: 16 | The shortest a window is, in samples. |
|---|
WINDOW_MOSTconstant | WINDOW_MOST: 16384 | The longest a window is, in samples: a spectrum costs about N log N, so its length is bounded as the work is. |
|---|
ANALYSIS_MOSTconstant | ANALYSIS_MOST: 16777216 | The most windowed samples (spectra times window length) a draw or the search for its top analyses. |
|---|
NO_LEVELconstant | number | The level of a mean square of naught, which has none (minus infinity): a picture draws it at the floor and its table writes "no signal". |
|---|
REFERENCE_CONTRACTconstant | Contract | A level reference's contract at the door: its rms or its full scale, and the words that name it. |
|---|
windowedfunction | windowed(name: WindowName, n: number): Window | The window of a form and a length, a power of two from 16 to 16,384, its points and sums taken; made once. |
|---|
planOffunction | planOf(name: WindowName, n: number): Plan | The plan for windows of one form and length: the mean squares of bins 0 to N/2 of a stretch of samples, by a radix-2 transform whose sines and cosines are the kernel's own; made once. |
|---|
heldReferencefunction | heldReference(r: Reference): void | A level reference held, or refused by name: a value above naught, as an rms in words or as full scale, one of the two. |
|---|
referencePowerfunction | referencePower(r: Reference): number | A reference's mean square: an rms squared, or a full-scale sine's, half the square of its peak. |
|---|
referenceWordsfunction | referenceWords(r: Reference): string | What the dB are against, in words: the reference's own, or "full scale". |
|---|
levelOffunction | levelOf(power: number, r: Reference): number | The level of a mean square against a reference: 10 log10 of their ratio, NO_LEVEL for naught; a mean square below naught or not finite is refused. |
|---|
hopOffunction | hopOf(n: number, overlap: number): number | A spectrogram's hop: the window less its overlap, to a whole number of samples, one at least. |
|---|
spectraCountfunction | spectraCount(samples: number, hop: number): number | How many spectra a series takes at a hop: one centred on every hop-th sample from the first, none centred past the last. |
|---|
spentfunction | spent(spectra: number, n: number, what: string, way?: string): void | The work held to ANALYSIS_MOST: spectra times window length windowed samples; refused naming the count and the way out. |
|---|
welchfunction | welch(x: ArrayLike<number>, from: number, to: number, scale: number, offset: number, plan: Plan, out: Float64Array): number | A spectrum's mean squares averaged as power over the whole blocks of N samples, half overlapped, that a stretch holds: written to out, the number of blocks returned; a stretch short of one block is refused. |
|---|
straightBetweenfunction | straightBetween(xs: ArrayLike<number>, ys: ArrayLike<number | null>, lo: number, hi: number): (x: number) => number | The straight line between a series' values at two limits, each on the line between the samples either side of it; a missing point there is refused. |
|---|
integratefunction | integrate(xs: ArrayLike<number>, ys: ArrayLike<number | null>, lo: number, hi: number, baseline?: (x: number) => number): number | The area between a series and a baseline over limits, by the trapezoid rule on the width of each step, so the same positive area whichever way x runs; the baseline the host's, else naught; a missing point is never stepped across. |
|---|
crossingsfunction | crossings(xs: ArrayLike<number>, vs: ArrayLike<number>, level: number, how?: CrossingWalk): Crossing[] | Where a series crosses a level, in the order walked from a sample in a direction, on the straight line between the two samples that straddle it (on log x where asked), or at the first sample of a run standing on it; a touch is no crossing. |
|---|
SCIENCE_DASHconstant | readonly [number, number] | The science look's dash, each dash 4 px on in a period of 7: the one pattern every chart that dashes a line or a ring in that look draws by. |
|---|
decadeGridfunction | decadeGrid(p: Stage, s: Linear, boxes: readonly Box[]): void | The decade grid of a log axis: down through each box a hairline at each decade the scale spans, in grid-major, and at 2 to 9 of every decade, in grid; laid before the marks it stands under, and refused on a scale that is not logarithmic. |
|---|
runsM4function | runsM4(values: readonly (number | null)[], xAt: (i: number) => number): number[][] | A series' points as it is drawn across pixel columns, one list of indexes for each run between its gaps, each run through its columns' first, least, greatest and last: so a gap breaks the line and no peak narrower than a pixel is lost. |
|---|
peakNamedfunction | peakNamed(p: Stage, n: PeakName, how?: Naming): boolean | A peak's name set where it stands clear: over its tip, beside it, then raised a row at a time and joined to its tip by a hairline; else left out, counted and carried whole. Whether it was set. |
|---|
calloutsLaidfunction | calloutsLaid(p: Stage, plot: Box, bands: readonly Callout[]): { rows: number; set: number; out: number } | Callouts laid in rows over a plot's top, each band's name and value on a hairline down to it, the nearest row where its label stands clear and crosses no leader; the rows used, the bands set and the bands left out. |
|---|
XML_DEPTH_MOSTconstant | XML_DEPTH_MOST: 32 | How deep elements may nest: the 33rd level is refused. |
|---|
attributeOffunction | attributeOf(start: XmlStart, name: string, namespace?: string): string | undefined | The value of a start tag's attribute by its local name and namespace (none for an unprefixed one), or none. |
|---|
XmlReaderclass | new XmlReader(bytes: Uint8Array, mode: XmlMode, options?: XmlOptions) { next(): XmlEvent | undefined; scope: XmlScope } | The events of an XML document, head or fragment, read from its bytes with no request: namespaces bound, references expanded, a fault met where the reader reaches it and refused by name with its byte. |
|---|
inflatedfunction | inflated(stream: Uint8Array, length: number): Uint8Array | A zlib stream read to its bytes, exactly the length asked: refused by name where the stream is not valid, would write past it, ends short of it, or fails its Adler-32. |
|---|
mzmlDecodedfunction | mzmlDecoded(bytes: Uint8Array): MzmlDecoded | An mzML 1.1.0 file decoded from its bytes with no request: each spectrum a centroid's peaks or a profile's points, each chromatogram its points, the version from its schema names, an index held to the elements it names; or refused by name. |
|---|
MzmlIndexedclass | new MzmlIndexed(read: ByteReader, size: number) { index(): Promise<MzmlIndex>; spectrum(id: string): Promise<MzmlSpectrum>; chromatogram(id: string): Promise<MzmlChromatogram>; said(): readonly string[] } | An mzML file too large to hold, read through its index: the host gives its reader and its size; its head, its tail and its index are read, then the bytes of each spectrum or chromatogram asked. |
|---|
jcampDecodedfunction | jcampDecoded(bytes: Uint8Array): JcampDecoded | A JCAMP-DX file decoded from its bytes with no request: infrared, Raman, NMR and mass spectra as spectra or peak tables, link blocks followed, an NMR spectrum's x put in ppm; or refused by name, with its line and column. |
|---|
touchstoneDecodedfunction | touchstoneDecoded(bytes: Uint8Array, ports?: number): TouchstoneDecoded | A Touchstone file (versions 1.0 to 2.1) decoded from its bytes with no request: an n-port of S-parameters over its sweep in hertz; a version 1 file's ports given by the host; or refused by name. |
|---|
chromatogramSamplefunction | chromatogramSample(): ChromatogramData | The Chromatogram's sample, made once: an analgesic tablet's extract on a C18 column, UV at 254 nm, ten minutes at 5 samples a second in mAU, four peaks named and aspirin's integrated. |
|---|
heldChromatogramfunction | heldChromatogram(d: ChromatogramData, o?: Options): void | A chromatogram's data held, or refused by name: its run a waveform or points, finite, its time rising; its peaks' apexes and limits inside the run; its baseline's times rising. |
|---|
chromatogramDrawnfunction | chromatogramDrawn(d: ChromatogramData, o: Options, t: Look, size: Size): Drawn | A chromatogram drawn: the run through each pixel column's first, least, greatest and last value, the host's peaks named over their apexes, its baseline, and the area of each peak it asks integrated, shaded and stated. |
|---|
chromatogramChartconstant | ChartDef<ChromatogramData> | The Chromatogram: a separation's detector response against retention time, the host's peaks named and their areas by the trapezoid rule, each named peak's share of the named areas. |
|---|
massSpectrumSamplefunction | massSpectrumSample(): MassSpectrumData | The Mass spectrum's sample, made once: toluene at 70 eV, its fragment ions near the published spectrum and its isotope peaks worked out from the elements. |
|---|
heldMassSpectrumfunction | heldMassSpectrum(d: MassSpectrumData): void | A mass spectrum held, or refused by name: a list of peaks the host picked (never a profile), one or more, their m/z rising, none below naught, the greatest above it; the molecular ion among them. |
|---|
massSpectrumDrawnfunction | massSpectrumDrawn(d: MassSpectrumData, o: Options, t: Look, size: Size): Drawn | A mass spectrum drawn: each ion a stick at its m/z as tall as its share of the base peak, the top peaks named by their m/z, the molecular ion marked and keyed, and M+1 stated where a peak stands one above it. |
|---|
massSpectrumChartconstant | ChartDef<MassSpectrumData> | The Mass spectrum: a compound's ions as sticks at their m/z, each as tall as its share of the base peak, the peaks picked by the host and never found here. |
|---|
SpectrumAxistype | { quantity: string; unit: string } | What an axis of a spectrum measures, in the words its field uses ("wavenumber", "m/z", "time"), and its unit as written ("cm-¹", "ppm", "min"). |
|---|
Spectrumtype | { name: string; x: SpectrumAxis; y: SpectrumAxis; values: (number | null)[]; grid?: { first: number; step: number }; xs?: number[] } | A trace of one quantity against another as an instrument or a file gives it: its values, a null where a point is missing or off scale, at its x on a steady grid (a first position and a step, negative where x falls) or at points, one of the two. |
|---|
Peakstype | { name: string; x: SpectrumAxis; y: SpectrumAxis; at: number[]; height: number[] } | A peak list as a mass spectrum carries it: each peak's position and height, the positions rising. |
|---|
WindowNametype | "hann" | "hamming" | "blackman-harris" | One of the windows a spectrum is taken under. |
|---|
Referencetype | { rms: number; words: string } | { fullScale: number; words?: string } | What the dB are against: a root mean square in the data's unit, in its words ("20 µPa"), or the greatest the samples hold (full scale), which the host gives. |
|---|
Windowtype | { name: WindowName; n: number; w: Float64Array; s1: number; s2: number; noiseBandwidth: number } | A window: its points, their sum S1 and sum of squares S2, and its noise bandwidth N times S2 over S1 squared, in bins. |
|---|
Plantype | { window: Window; powers(x: ArrayLike<number>, first: number, scale: number, offset: number, out: Float64Array): void } | A plan for windows of one length and form: its mean squares of bins 0 to N/2 from a stretch of samples, each sample times a scale plus an offset, written to out; a sample or a number that is not finite is refused. |
|---|
Crossingtype | { x: number; i: number; j: number; t: number; rising: boolean } | A crossing of a level: where it stands, the samples it falls between, the share of the way from the first to the second on the line it was placed on, and whether the series was going up through the level, in the way walked. |
|---|
CrossingWalktype | { from?: number; direction?: 1 | -1; log?: boolean; most?: number } | How a series is walked for its crossings: from a sample, in a direction, on log ten of x, to at most so many. |
|---|
Runtype | { text: string; role: WordRole; ink?: string } | One run of a name's words, in its role and, where it has one, its own ink. |
|---|
PeakNametype | { x: number; y: number; lines: Run[][]; whole: string } | A peak's name: its tip's place on the picture, its words as lines of runs, and the name whole, which a name left out is carried by. |
|---|
Namingtype | { within?: Box; blocked?: (b: Box) => boolean; rows?: number } | Where a name may stand: inside a box, clear of the marks the chart says are taller, and raised at most so many rows (3 by default). |
|---|
Callouttype | { x: number; y: number; name: string; value: string } | A band the host names over a spectrum: where it stands across and the picture's y of its feature, its name and its value, as the words stand. |
|---|
NPorttype | { ports: number; parameter: "S"; frequencies: number[]; references: number[]; matrices: { re: number[]; im: number[] }[] } | An n-port's S-parameters over a sweep: the frequencies in hertz, rising; each port's reference resistance in ohms; for each frequency the n by n matrix of complex values as real and imaginary parts, row by row. |
|---|
TouchstoneDecodedtype | { nport: NPort; version: "1.0" | "1.1" | "2.0" | "2.1"; noise: number; said: string[] } | A Touchstone file decoded: its n-port, the form it is in, how many noise records it holds after its network data (read as numbers and left out), and what the reading says of it. |
|---|
JcampNmrtype | { frequency: number; nucleus?: string; solvent?: string; solventReference?: number; reference: { kind: "INTERNAL" | "EXTERNAL"; name: string; point: number; ppm: number } } | What a JCAMP-DX NMR spectrum says of its measurement and of the reference that puts its hertz on a ppm scale, as the file wrote it. |
|---|
JcampBlocktype | { title: string; dataType: string; version: string; within: string[]; spectrum?: Spectrum; peaks?: Peaks; missing: number; nmr?: JcampNmr } | One data block of a JCAMP-DX file: its title, data type and version, the link blocks it stands in, the spectrum or the peaks it gives, how many ordinates were missing, and for an NMR spectrum its measurement and reference. |
|---|
JcampDecodedtype | { version: string; blocks: JcampBlock[]; said: string[] } | A JCAMP-DX file decoded: the version its first block names, its data blocks in the order they stand, and what the reading says of it. |
|---|
MzmlTimetype | { value: number; unit: string } | A time as an mzML file gives it: its number and its unit, "s" or "min". |
|---|
MzmlCentroidtype | { form: "centroid"; peaks: Peaks } | A centroid spectrum of an mzML file, with its id and index and, where the file gives them, its ms level and start: its peaks. |
|---|
MzmlProfiletype | { form: "profile"; trace: Spectrum } | A profile spectrum of an mzML file, with its id and index and, where the file gives them, its ms level and start: its points, the positions as xs and the intensities as values. |
|---|
MzmlSpectrumtype | MzmlCentroid | MzmlProfile | A spectrum of an mzML file, its form said. |
|---|
MzmlChromatogramtype | { id: string; index: number; tic: boolean; trace: Spectrum } | A chromatogram of an mzML file: its id and index, whether it is a total ion current chromatogram, and its points, the times as xs in the unit its time array names. |
|---|
MzmlDecodedtype | { version: string; spectra: MzmlSpectrum[]; chromatograms: MzmlChromatogram[]; said: string[] } | An mzML file decoded: its version from the schema name, its spectra and chromatograms in the order written, and what the reading says of it. |
|---|
MzmlIndextype | { version: string; spectra: string[]; chromatograms: string[] } | The ids a file too large to hold lists in its index, in its order, and its version. |
|---|
ChromatogramPeaktype | { name?: string; apex?: number; from?: number; to?: number; integrate?: boolean } | A peak the host names on a chromatogram: its compound, its apex time and its limits in minutes where it integrated it, and whether it asks its area shaded and stated. |
|---|
ChromatogramBaselinetype | { at: number[]; signal: number[] } | The integration baseline the host gives: a line through its points, their times in minutes, rising, and the signal in its unit. |
|---|
ChromatogramDatatype | { waveform?: Waveform; points?: Spectrum; peaks?: ChromatogramPeak[]; baseline?: ChromatogramBaseline } | A chromatogram's data: the run, a waveform at a steady rate or points of time and signal, one of the two; the host's peaks and its baseline. |
|---|
MassSpectrumDatatype | { peaks: Peaks | Spectrum; molecularIon?: number; ionisation?: string } | A mass spectrum's data: the peaks the host picked, the molecular ion it names (its m/z, among the peaks), and the ionisation the context says. |
|---|
SpectrumBandtype | { at: number; name?: string } | A band the host names on a spectrum: where it stands across, and the group that gives it where the host names one. |
|---|
SpectrumDatatype | { spectrum: Spectrum; bands?: SpectrumBand[] } | A spectrum chart's data: the spectrum as the instrument gives it, on a steady grid or at points, and the host's bands. |
|---|
heldSpectrumDatafunction | heldSpectrumData(d: SpectrumData): void | The Spectrum's data held, or refused by name: its x steady or at points, strictly rising or falling, two points or more; a y the chart draws; each band inside the spectrum with a point in its window. |
|---|
heldIrSpectrumfunction | heldIrSpectrum(d: SpectrumData): void | The IR spectrum's data held: the Spectrum's, and a wavenumber or a Raman shift for its x; a wavelength is refused by name, sent to the Spectrum, which draws it in its own unit. |
|---|
heldRamanSpectrumfunction | heldRamanSpectrum(d: SpectrumData): void | The Raman spectrum's data held: the Spectrum's, and a Raman shift or a wavenumber for its x; a wavelength is refused by name. |
|---|
heldUvVisSpectrumfunction | heldUvVisSpectrum(d: SpectrumData): void | The UV-Vis spectrum's data held: the Spectrum's, and a wavelength in nm for its x. |
|---|
spectrumDrawnfunction | spectrumDrawn(d: SpectrumData, o: Options, t: Look, size: Size): Drawn | The Spectrum drawn: any x in its own unit, rising unless the host asks; the trace through each pixel column's first, least, greatest and last value; the host's bands named in rows over the plot or over their tips. |
|---|
irSpectrumDrawnfunction | irSpectrumDrawn(d: SpectrumData, o: Options, t: Look, size: Size): Drawn | The IR spectrum drawn: the wavenumber falling, a transmittance band a dip. |
|---|
ramanSpectrumDrawnfunction | ramanSpectrumDrawn(d: SpectrumData, o: Options, t: Look, size: Size): Drawn | The Raman spectrum drawn: counts against a shift rising, the laser said where the host gives it. |
|---|
uvVisSpectrumDrawnfunction | uvVisSpectrumDrawn(d: SpectrumData, o: Options, t: Look, size: Size): Drawn | The UV-Vis spectrum drawn: absorbance against a wavelength in nm rising, each maximum named over its tip, the concentration and the path said where the host gives them. |
|---|
spectrumSamplefunction | spectrumSample(): SpectrumData | The Spectrum's sample, made once: a polystyrene film's transmittance against wavelength from 2.5 to 25 micrometres, as a dispersive instrument scans it, four bands named. |
|---|
irSpectrumSamplefunction | irSpectrumSample(): SpectrumData | The IR spectrum's sample, made once: polystyrene film on a 1 cm-¹ grid from 4,000 to 400, in transmittance, six bands named. |
|---|
ramanSpectrumSamplefunction | ramanSpectrumSample(): SpectrumData | The Raman spectrum's sample, made once: polystyrene at 785 nm on a 1 cm-¹ grid from 200 to 3,200, in counts, over a slow fluorescent background, five bands named. |
|---|
uvVisSpectrumSamplefunction | uvVisSpectrumSample(): SpectrumData | The UV-Vis spectrum's sample, made once: riboflavin, 20 µM in water in a 1 cm cell, 200 to 600 nm every nm, four maxima. |
|---|
spectrumChartconstant | ChartDef<SpectrumData> | The Spectrum: a spectrum in its own x, a wavelength, a wavenumber or a shift, its bands named; the infrared, Raman and UV-Vis presets are its. |
|---|
irSpectrumChartconstant | ChartDef<SpectrumData> | The IR spectrum, the Spectrum's preset: the wavenumber falling from 4,000 to 400 cm-¹ with transmittance up, so a band is a dip. |
|---|
ramanSpectrumChartconstant | ChartDef<SpectrumData> | The Raman spectrum, the Spectrum's preset: counts against a shift rising, its bands named. |
|---|
uvVisSpectrumChartconstant | ChartDef<SpectrumData> | The UV-Vis spectrum, the Spectrum's preset: absorbance against a wavelength in nm rising, its maxima named over their tips. |
|---|
NmrMultiplettype | { from: number; to: number; multiplicity: string; assignment?: string } | A multiplet the host picked on an NMR spectrum: its range in ppm, its multiplicity as the host writes it, and the group it is assigned to. |
|---|
NmrSampletype | { name: string; spectrum: Spectrum; protons?: number; baseline?: number; multiplets?: NmrMultiplet[] } | A sample of a stacked NMR: its name, its spectrum in ppm, its protons where the host gives its total, the level its integrals are measured from, and its multiplets. |
|---|
StackedNmrDatatype | { samples: NmrSample[]; nucleus?: string; frequency?: number; solvent?: string; integralUnit?: string; measures?: { name: string; value: string }[] } | A stacked NMR's data: the samples, bottom to top, and what the context and the measurements say of the run. |
|---|
heldStackedNmrfunction | heldStackedNmr(d: StackedNmrData, o: Options): void | A stacked NMR's data held, or refused by name: twelve samples at most, each in ppm with a line above its baseline; each multiplet inside its spectrum and rising; where integrals are drawn, no missing point in a range and areas that sum above naught. |
|---|
stackedNmrDrawnfunction | stackedNmrDrawn(d: StackedNmrData, o: Options, t: Look, size: Size): Drawn | A stacked NMR drawn: each sample to its own tallest line on a baseline one pitch above the last, the shift falling across, each multiplet named over its tallest line and its integral on a bracket under the baseline. |
|---|
stackedNmrSamplefunction | stackedNmrSample(): StackedNmrData | The Stacked NMR's sample, made once: ethanol, ethyl acetate and ethyl benzoate in CDCl3 at 80 MHz, each multiplet its protons' first-order pattern. |
|---|
stackedNmrChartconstant | ChartDef<StackedNmrData> | The Stacked NMR: the spectra of several samples offset up one chemical-shift axis, each multiplet named with its integral, no value axis since intensity is arbitrary. |
|---|
AnalysedSpectratype | { at: number[]; spectra: Spectrum[]; window?: string } | Spectra already analysed that a spectrogram draws: the time of each, in seconds, and each spectrum as levels in dB on one rising grid of frequencies in Hz; the window that made them, in the host's words. |
|---|
SpectrogramDatatype | { waveform?: Waveform; analysed?: AnalysedSpectra; reference: Reference; top?: number } | A spectrogram's data: a waveform, held or by range, or spectra already analysed, one of the two; what the dB are against; and the level at the top of the ramp where the host fixes it. |
|---|
heldSpectrogramfunction | heldSpectrogram(d: SpectrogramData, o: Options): void | A spectrogram's data held, or refused by name: a waveform or spectra, one of the two; a reference above naught; every sample finite; the work within ANALYSIS_MOST spectra times window length. |
|---|
spectrogramDrawnfunction | spectrogramDrawn(d: SpectrogramData, o: Options, t: Look, size: Size): Drawn | A spectrogram drawn: time across, frequency up, each cell inked by its level on the ramp the key shows, a level absolute and the top fixed, so the same cell keeps its ink at every pan and zoom. |
|---|
spectrogramSamplefunction | spectrogramSample(): SpectrogramData | The Spectrogram's sample, made once: one spoken syllable at 16 kHz for 0.9 s, a fricative then a voiced diphthong, by source and filter. |
|---|
spectrogramChartconstant | ChartDef<SpectrogramData> | The Spectrogram: a waveform's spectra over time, frequency up and level as ink, computed here by Heinzel's windowed transform; a waveform by range is drawn on the samples held and asks the host for the rest. |
|---|
SpectrumWaterfallRuntype | { quantity: string; unit: string; values: number[] } | The run a waterfall's spectra step along: what it is ("speed", "time"), its unit ("rpm", "s") and its value at each spectrum, rising or falling. |
|---|
SpectrumWaterfallWindowtype | { name: string; length: number; averages: number; rate?: number } | The window and the averages that made each spectrum of a waterfall, in the host's words: its name, its length in samples, the blocks averaged, and its sampling rate where it says the length in time. |
|---|
SpectrumWaterfallDatatype | { spectra: Spectrum[]; run: SpectrumWaterfallRun; reference: Reference; window?: SpectrumWaterfallWindow; floor?: number; orders?: number[] } | A spectrum waterfall's data: spectra in order, each its levels in dB on one frequency grid; the run's value at each; what the dB are against; and the host's window, floor and orders. |
|---|
heldSpectrumWaterfallfunction | heldSpectrumWaterfall(d: SpectrumWaterfallData, o: Options): void | A spectrum waterfall's data held, or refused by name: two spectra or more on one frequency grid in Hz, each a level in dB at every frequency; a value of the run to each, strictly rising or falling; orders only on a run in rpm. |
|---|
spectrumWaterfallDrawnfunction | spectrumWaterfallDrawn(d: SpectrumWaterfallData, o: Options, t: Look, size: Size): Drawn | A spectrum waterfall drawn: one line a spectrum, each an offset up and across from the one nearer and hiding the one behind, on one scale a bar holds; the run named along the baselines, the host's orders dashed along their ridges. |
|---|
spectrumWaterfallSamplefunction | spectrumWaterfallSample(): SpectrumWaterfallData | The Spectrum waterfall's sample, made once: a four-cylinder engine's noise at the driver's ear in a run-up from 1,000 to 6,000 rpm, a spectrum every 100 rpm, in dB re 20 µPa. |
|---|
spectrumWaterfallChartconstant | ChartDef<SpectrumWaterfallData> | The Spectrum waterfall: spectra one behind another at their speeds or times, the nearer hiding the farther, so an order shows as a diagonal ridge and a resonance as one that stands in place. |
|---|
BodeSystemtype | { name: string; gain: ArrayLike<number>; phase: ArrayLike<number> } | A system on a Bode plot: its name, its gain and its phase in degrees at every frequency. |
|---|
BodeDatatype | { frequencies: ArrayLike<number>; gainIn: "dB" | "ratio"; systems: BodeSystem[] } | A Bode plot's data: the frequencies in hertz, rising; whether the gains are in dB or a ratio; and the systems drawn on them. |
|---|
heldBodePlotfunction | heldBodePlot(d: BodeData, o?: Options): void | A Bode plot's data held, or refused by name: two frequencies or more above naught, rising; a gain and a phase to each frequency of each system, finite; a gain as a ratio above naught. |
|---|
bodePlotDrawnfunction | bodePlotDrawn(d: BodeData, o: Options, t: Look, size: Size): Drawn | A Bode plot drawn: gain over phase on one log frequency axis, the phase unwrapped; a filter's passband and its -3 dB point, a loop's crossover, phase margin, phase crossover and gain margin, each read from the samples by straight lines between them. |
|---|
bodePlotSamplefunction | bodePlotSample(): BodeData | The Bode plot's sample, made once: a second-order Butterworth low-pass, its phase continuous through the cut-off. |
|---|
bodeServoSamplefunction | bodeServoSample(): BodeData | The Bode plot's loop sample, made once: a servo's open loop, an integrator with two poles and a delay, which costs phase and no gain. |
|---|
bodePlotChartconstant | ChartDef<BodeData> | The Bode plot: gain and phase against frequency on one log axis, a filter's -3 dB point or a loop's margins read from the samples. |
|---|
SmithMarkertype | { frequency: number; name?: string } | A marker the host sets on a Smith chart: a frequency in hertz and its name. |
|---|
SmithDatatype | { nport: NPort; markers?: SmithMarker[] } | A Smith chart's data: an n-port, of which port one's S11 is drawn, and the host's markers. |
|---|
heldSmithChartfunction | heldSmithChart(d: SmithData, o?: Options): void | A Smith chart's data held, or refused by name: an S n-port of one port or more, its references resistances above naught, its frequencies rising, one matrix a frequency; the markers inside the sweep; a reflection that renormalises to a finite one. |
|---|
smithChartDrawnfunction | smithChartDrawn(d: SmithData, o: Options, t: Look, size: Size): Drawn | A Smith chart drawn: S11 across the sweep on the reflection plane, its constant-resistance and constant-reactance circles, the best match, the VSWR circle and the band within it, the host's markers read as impedance. |
|---|
smithChartSamplefunction | smithChartSample(): SmithData | The Smith chart's sample, made once: a 2.45 GHz patch antenna's S11 from 2.20 to 2.70 GHz in 50 ohms, markers at 2.40, 2.45 and 2.50 GHz. |
|---|
smithChartconstant | ChartDef<SmithData> | The Smith chart: an n-port's S11 across a sweep on the reflection plane, its best match, its VSWR circle and its bandwidth. |
|---|
PolarCuttype | { name: string; angles: number[]; gain: number[]; frequency?: number } | A cut of a radiation pattern: its name, its directions in degrees and the gain in dBi at each, and its frequency in hertz where it differs from the pattern's. |
|---|
PolarDatatype | { cuts: PolarCut[]; frequency?: number } | An antenna polar's data: the pattern's cuts, and the frequency in hertz they were taken at. |
|---|
heldAntennaPolarfunction | heldAntennaPolar(d: PolarData, o?: Options): void | An antenna polar's data held, or refused by name: one cut or more, each named once and read, a gain to every direction; the cuts' frequencies alike or each its own; the scale's options readable. |
|---|
antennaPolarDrawnfunction | antennaPolarDrawn(d: PolarData, o: Options, t: Look, size: Size): Drawn | An antenna polar drawn: each cut's gain round the circle clockwise, the half-power ring, and for each cut its beamwidth, its peak and its front-to-back ratio read from the samples; the cuts named at leaders. |
|---|
antennaPolarSamplefunction | antennaPolarSample(): PolarData | The Antenna polar's sample, made once: a 2.45 GHz patch on a finite ground plane, its E-plane and H-plane cuts a degree apart. |
|---|
antennaPolarChartconstant | ChartDef<PolarData> | The Antenna polar: a radiation pattern's cuts as gain against direction round a circle, clockwise, with the half-power ring and each cut's beamwidth and front-to-back ratio. |
|---|
SleepStagetype | "Wake" | "REM" | "N1" | "N2" | "N3" | "Not scored" | A stage of sleep, as the hypnogram draws them. |
|---|
NightDatatype | { stages: string[]; start?: string; length?: number; stageNames?: { [name: string]: string }; recordedTo?: number } | A night: each epoch's stage as the host names it, from the record's start; the clock at the record's start; the record's length in seconds; the host's mapping from its stage names to the six; and the seconds recorded so far, while it is being recorded. |
|---|
heldHypnogramfunction | heldHypnogram(d: NightData, o?: Options): void | A night held, or refused by name: a stage to every epoch, each a stage or one the host's mapping gives, a clock that reads, a length of whole epochs. |
|---|
hypnogramDrawnfunction | hypnogramDrawn(d: NightData, o: Options, t: Look, size: Size): Drawn | A hypnogram drawn: the five stages as rows against the clock, REM in series two's ink; total sleep time, efficiency, sleep onset, REM latency, WASO and WASF worked out from the epochs and stated, each stage's share. |
|---|
hypnogramSamplefunction | hypnogramSample(): NightData | The Hypnogram's sample, made once: a night as an EDF+ file's annotations carry it, a stage for each 30 s epoch, lights off at 23:00 and on eight hours later. |
|---|
hypnogramChartconstant | ChartDef<NightData> | The Hypnogram: a night's sleep stages as rows against the clock, the night's totals worked out from its epochs and stated. |
|---|
CrossPlotAxistype | { series: string; lo?: number; hi?: number } | An axis of a cross-plot, or what colours its points: a series of the well by its mnemonic, and the limits the host gives, either or both. |
|---|
CrossPlotPlacetype | { x: number; y: number } | A place on a cross-plot, in the units of its x and its y. |
|---|
CrossPlotLinetype | { name: string; points: CrossPlotPlace[]; marks?: CrossPlotPlace[] } | One of the host's lines on a cross-plot: its name, its points in order, and the places it is marked at. |
|---|
CrossPlotDatatype | { well: Well; x: CrossPlotAxis; y: CrossPlotAxis; colour: CrossPlotAxis; lines?: CrossPlotLine[]; leaveOut?: boolean } | A cross-plot's data: a well, its series across, up or down and colouring the points, the host's lines, and whether a value at or under naught on a log axis is left out and counted rather than refused. |
|---|
heldCrossPlotfunction | heldCrossPlot(d: CrossPlotData, o: Options): void | A cross-plot held, or refused by name: its well; its three series held by the well; each axis's limits rising, above naught on a log axis, as is every value on it unless left out; each line named, of two points or more, three at most; drawn as points, 500,000 at most. |
|---|
crossPlotDrawnfunction | crossPlotDrawn(d: CrossPlotData, o: Options, t: Look, size: Size): Drawn | A cross-plot drawn: a point a sample on its step of the third series, the samples missing a value and the points outside the axes counted, the host's lines over them named at their ends; or the points as a density of counts. |
|---|
crossPlotSamplefunction | crossPlotSample(): CrossPlotData | The cross-plot's sample, made once: one well's neutron porosity against its bulk density coloured by its gamma ray, with the host's sandstone, limestone and dolomite lines. |
|---|
crossPlotChartconstant | ChartDef<CrossPlotData> | The Cross-plot: one series of a well against another, a point a sample coloured by a third, over the host's lines. |
|---|
Filterstype | { highPass?: number; lowPass?: number; notch?: number } | The display filters a strip chart's row is drawn through, each in hertz, each left out where not given or naught. |
|---|
Sectiontype | { b0: number; b1: number; b2: number; a1: number; a2: number; tau: number } | A second-order section of a display filter, transposed, and its time constant in seconds: its poles'. |
|---|
FILTERSconstant | readonly ["highPass", "lowPass", "notch"] | The display filters by name, in the order a row is drawn through them. |
|---|
NOTCH_Qconstant | NOTCH_Q: 30 | The notch's Q: the band it takes 3 dB from is its frequency over 30 wide. |
|---|
WARM_UP_TAUSconstant | WARM_UP_TAUS: 5 | How many of the slowest section's time constants a row's filters run before its view. |
|---|
sectionsOffunction | sectionsOf(f: Filters, rate: number): { sections: Section[]; left: ("highPass" | "lowPass" | "notch")[] } | The sections a row at a rate is drawn through, Butterworth high- and low-pass and the notch at Q 30, their coefficients from det; the filters at or past half the rate left out and named; a frequency below naught refused by name. |
|---|
warmUpOffunction | warmUpOf(sections: Section[]): number | The seconds a row's filters run before its view: five of the slowest section's time constant. |
|---|
filteredfunction | filtered(x: ArrayLike<number>, sections: Section[]): Float64Array | Values drawn through the sections in turn, each starting at rest on its first input as if it had always stood. |
|---|
| function | filtersSaid(f: Filters): string | The filters as the context line says them: "1–70 Hz, notch 50 Hz". |
|---|
AVERAGEconstant | "Avg" | What a montage row's second part names to take the mean of all the montage's electrodes. |
|---|
MontageRowtype | readonly [string, string] | A montage's row: an electrode less another, or less the average. |
|---|
MontageChaintype | { name: string; rows: MontageRow[] } | A chain of a montage's rows, drawn as one group. |
|---|
Montagetype | { name: string; chains: MontageChain[] } | A montage: its name and its chains in order; a host may give its own. |
|---|
DOUBLE_BANANAconstant | Montage | The ACNS longitudinal bipolar montage: the temporal chains left then right, the parasagittal left then right, then the midline. |
|---|
TRANSVERSEconstant | Montage | The transverse bipolar montage, its chains across the head from front to back. |
|---|
AVERAGE_REFERENCEconstant | Montage | The average reference: each of the 19 electrodes less the mean of all of them, in the double banana's five chains. |
|---|
MONTAGESconstant | readonly Montage[] | The montages a clinic names: the double banana, the transverse and the average. |
|---|
montagedfunction | montaged(electrodes: Waveform[], m: Montage): { data: StripData; left: string[] } | A montage's rows from a record's held electrodes, each chain a group, each row its parts' difference sample by sample, the average with every electrode in it; electrodes found as recorders label them; what was left out said; made once a record and montage. |
|---|
extremesOffunction | extremesOf(values): Extremes | A series' extremes, built once and kept while the series lives. |
|---|
m4Windowfunction | m4Window(extremes, i0, i1, cols): number[] | M4 over a window of the data into pixel columns, from the series' extremes. |
|---|
Streamclass | new Stream(capacity): { push; pushAll; at; window(); length; total; bytes } | The last capacity values of a feed in fixed memory: a ring allocated once, and a window handed to a chart in order, oldest first. |
|---|