Accessibility report
This report is self-assessed, apart from the rows the Power BI visual's own harness measures (marked so in their own text); an independent audit with screen-reader users is still to do for both platforms. Every accessibility feature in it is on every plan, Free included: accessibility is never held back.
Hue Charts is in beta and free to use: every everyday chart, for any use, with the Hue Charts credit on its pictures. A Business or Enterprise plan covers a whole organisation, gives it the paid packages, which draw no credit and draw the charts of science, and the Power BI visual, and brings the company behind it: £1,000 a year or £100 a month, or £5,000 a year or £500 a month.
- 57 supports
- 4 partially
- 19 not applicable
- labels ≥ 5.86:1
- series ≥ 3.03:1
Without colour
Readable with no colour at all
Loading the chart library…
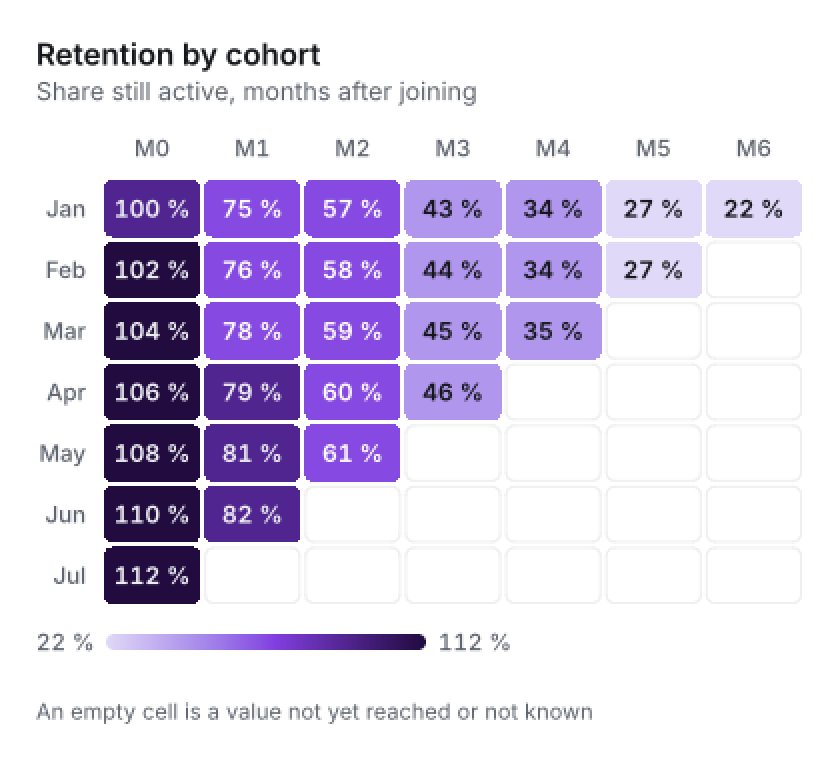
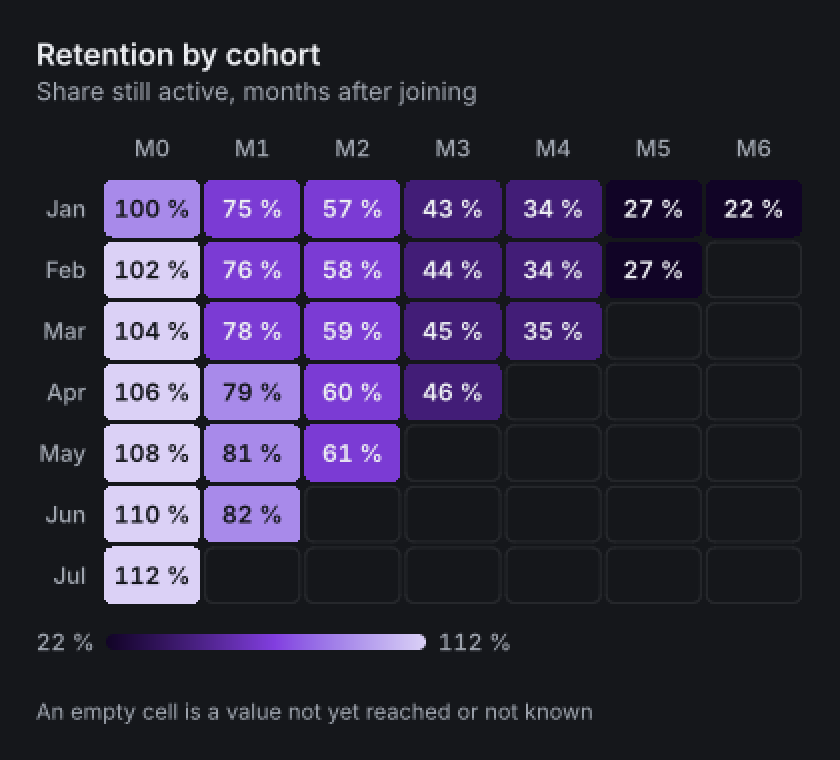
The same chart in colour and in grey, with the stripes asked for, as for print: the first series solid and each after it hatched, and every bar its separator from the next, so the series stand apart with no colour at all.
Your brand
Your brand's colour, made a theme
Loading the chart library…
WCAG 2.2
Every criterion, level A and AA
Every chart, wherever it runs
| Criterion | Level | Conformance | How |
|---|---|---|---|
| 1.2.1 Audio-only and video-only (prerecorded)An alternative for prerecorded audio or video alone. | A | Not applicable | The visual plays no audio or video. |
| 1.2.2 Captions (prerecorded)Captions for prerecorded video. | A | Not applicable | No video. |
| 1.2.3 Audio description or media alternative (prerecorded)Video described. | A | Not applicable | No video. |
| 1.2.4 Captions (live)Captions for live video. | AA | Not applicable | No video. |
| 1.2.5 Audio description (prerecorded)Video described. | AA | Not applicable | No video. |
| 1.4.4 Resize textText scales to 200%. | AA | Supports | Labels are text in CSS pixels over the chart, never drawn into pixels, so they scale with zoom: the browser's own zoom on the web, and the report's zoom through Power BI's zoom on the visual. Self-assessed; 200% zoom is not yet checked by hand. |
| 1.4.12 Text spacingSurvives user spacing. | AA | Supports | Labels are single lines placed by their anchor, never clipped to a box; added letter or word spacing widens them. Self-assessed; not yet tested with the spacing bookmarklet. |
| 2.3.1 Three flashesNothing flashes. | A | Supports | No chart flashes. |
The web: the library and Chart Studio
| Criterion | Level | Conformance | How |
|---|---|---|---|
| 1.1.1 Non-text contentEvery chart has a text alternative. | A | Supports | The canvas is named with the chart's title, kind and number of points; every datum is a row of the data table beside it, which downloads as CSV; SVG exports carry a title and a description listing every datum; PDFs carry the text as text. |
| 1.3.1 Info and relationshipsStructure is available to assistive technology. | A | Supports | The data table gives each datum as a row, its series, category and value as cells, in reading order; legend entries are buttons with a pressed state. |
| 1.3.2 Meaningful sequenceReading order is correct. | A | Supports | The keyboard and the data table walk the data in the same order, the data's own: series by series, category by category, so what is heard is what the table holds. |
| 1.3.3 Sensory characteristicsInstructions do not rely on shape, colour or position alone. | A | Supports | Instructions name keys and controls (arrow keys, Home, End, Escape, plus and minus), not colours or places. |
| 1.3.4 OrientationWorks in either orientation. | AA | Supports | Charts scale to their container's width at a fixed aspect ratio. |
| 1.3.5 Identify input purposeInputs about the user are identified. | AA | Not applicable | The library collects no personal data. |
| 1.4.1 Use of colourColour is not the only means of conveying information. | A | Partially supports | Supports to six series. Every series is named in words: at its marks where the chart names it there (a line at its end, a pyramid's side over its half, a part on its slice), else on its chip, and in every announced point and every row of the data table. A series that neither its name at its marks nor its place tells apart is drawn in its pattern, each series past the first hatched, dashed and its points shaped, its chip too; the stripes option draws every series in its pattern, so the picture itself reads without colour and in black and white. A picture that draws observation is inked by its read-out alone and takes no hatch; its series are named by their order, a line by its dash, a point by its marker's shape, and a fill by a dash on its outline in the ground's ink. Six series each take a pattern of their own; past six, a series repeats a pattern, and the legend, the announcements and the data table name it. |
| 1.4.3 Contrast (minimum)Text at 4.5:1. | AA | Partially supports | Every label role on the page's ground, both grounds, computed below: the lowest is 5.86:1. A value label set on a mark takes the ink that stands further from the mark; over every mark from black to white the least it reaches is 3.95:1, below 4.5:1 on marks of middling lightness. |
| 1.4.5 Images of textText is text. | AA | Supports | On the page, every label is live text. The lettered PNG, for files made with no page, is an export and says so. |
| 1.4.10 ReflowNo two-dimensional scrolling at 320 px. | AA | Supports | A chart fills its container's width and keeps its aspect ratio. Self-assessed; reflow at 320 px is not yet tested. |
| 1.4.11 Non-text contrastGraphical objects at 3:1. | AA | Supports | Every chart is drawn compliant whatever the reader sets: series inks solved to stand 3:1 from the ground, the lowest across the themes below 3.03:1; a lightness, a brand, a chosen colour or a palette that would sink is moved to its nearest passing lightness, its hue held, and said; where series touch, the ground stands between them. The library's tests hold every control at its extremes on both grounds. A high-contrast switch, and forced colours, raise them further. An observed lightness is never moved: a mark of a picture that draws observation below 3:1 carries its value in visible text, labelled or in the data table shown open. |
| 1.4.13 Content on hover or focusDismissible, hoverable, persistent. | AA | Supports | The tooltip stays while the pointer or focus is on the datum, never covers the pointer, and Escape dismisses it and the focus ring. |
| 2.1.1 KeyboardEverything by keyboard. | A | Supports | Arrow keys walk the data, Home and End jump, plus and minus zoom, shift with the arrows pans, zero resets; legend entries and series switches are buttons. |
| 2.1.2 No keyboard trapFocus can leave. | A | Supports | Tab leaves the chart as from any control. |
| 2.1.4 Character key shortcutsSingle-key shortcuts can be turned off or act only on focus. | A | Supports | Keys act only while the chart has focus. |
| 2.2.2 Pause, stop, hideMoving content can be paused. | A | Supports | A chart moves only toward its objective and settles in a number of turns set by its series, shown at the page's 120 turns a second: computed from the library, 3 series in 141 turns (1.2 s), 5 series in 237 turns (2.0 s), 8 series in 379 turns (3.2 s); entering or moving to a change; a settle-now control beside the meter shows the settled chart at once, and the movement switch turns movement off; live charts and the stream have Pause and Stop; a reader who asks for reduced motion gets each finished picture with no movement at all. |
| 2.4.3 Focus orderFocus order preserves meaning. | A | Supports | The chart, then its legend entries, then its toolbar, in document order. |
| 2.4.7 Focus visibleThe focus is visible. | AA | Supports | The chart shows a focus ring and a ring round the focused datum; buttons show the system Highlight outline. |
| 2.4.11 Focus not obscuredFocus is not hidden. | AA | Supports | Nothing overlays the chart. |
| 2.5.7 Dragging movementsDragging has an alternative. | AA | Supports | Pan by drag is also shift with the arrow keys; zoom by wheel is also plus and minus. |
| 2.5.8 Target size (minimum)Targets at least 24 by 24 px, or an equivalent that is. | AA | Supports | Legend entries are small, and the series switches under the chart do the same thing at 24 px, which the criterion's equivalent exception allows. |
| 3.1.2 Language of partsA passage in another language is identified. | AA | Supports | A chart's words are the data's and the page's own; the library adds no passage in another language. Numbers and dates follow the reader's locale, and a right-to-left reader gets the chart mirrored. |
| 3.2.1 On focus / 3.2.2 On inputNo change of context. | A | Supports | Focus and input change the chart, never the page. |
| 3.3.1 Error identificationErrors are described in text. | A | Supports | Data or a recipe that does not fit is refused with each error named, from the JSON Schema. |
| 4.1.2 Name, role, valueControls expose name, role and state. | A | Supports | The chart is an application with a name; legend entries and series switches are buttons with aria-pressed. |
| 4.1.3 Status messagesStatus is announced. | AA | Supports | The focused datum is announced through a polite live region: its place and its text. |
Power BI: the visual in its own frame
The visual lives inside Power BI's own frame — its report page, tooltips, Format pane and “Show as a table” are Power BI's, which Microsoft reports on separately. The rows below cover what the visual itself draws and does inside its own frame.
| Criterion | Level | Conformance | How |
|---|---|---|---|
| 1.1.1 Non-text contentEvery chart has a text alternative. | A | Supports | The visual names itself with the chart's title, its number of data points and the ground it is drawn on; with no fields it says in words which fields the chart needs. Every datum is a row of Power BI's "Show as a table" and of the CSV the visual saves; the PDF it saves carries its text as text. The alt text a report's author gives the visual is Power BI's own, in its General settings. |
| 1.3.1 Info and relationshipsStructure is available to assistive technology. | A | Supports | Power BI's "Show as a table" gives the visual's fields as rows and columns; the CSV the same. The datum the keyboard stands on is said with its place, its series, its category and its value. |
| 1.3.2 Meaningful sequenceReading order is correct. | A | Supports | The keyboard walks the data in the chart's own order, series by series, category by category. |
| 1.3.3 Sensory characteristicsInstructions do not rely on shape, colour or position alone. | A | Supports | What the visual says names fields, keys and controls ("Add a Category", the Format pane's Chart card), never a colour or a place. |
| 1.3.4 OrientationWorks in either orientation. | AA | Supports | The visual draws at whatever size Power BI gives it, in either orientation. |
| 1.3.5 Identify input purposeInputs about the user are identified. | AA | Not applicable | The visual draws no field of its own; the ask in words is in the Format pane and asks for a chart, nothing about the user. |
| 1.4.1 Use of colourColour is not the only means of conveying information. | A | Partially supports | Supports to six series, as the library does. Series are named in the picture as the library names them, and in every announced datum, every tooltip and every row of "Show as a table". A series that neither its name at its marks nor its place tells apart is hatched, dashed and its points shaped, each such series past the first; Legend's "Every series in its pattern, for print" draws every series so. A selection or another visual's highlight draws the rest back toward the ground, a change of lightness, not of hue. Past six series a pattern repeats, and the names carry the series. |
| 1.4.2 Audio controlSound that plays by itself can be stopped. | A | Not applicable | Nothing plays a sound. |
| 1.4.3 Contrast (minimum)Text at 4.5:1. | AA | Partially supports | The chart is drawn on the report theme's background, which the visual measures every word against: a word ink below 4.5:1 there is moved to its nearest passing lightness and the move said in Power BI's warning icon. On the library's own grounds the lowest label is 5.86:1, and a value label on a mark takes the ink standing further from it, at least 3.95:1 over every mark from black to white. In high contrast the words take Power BI's foreground. |
| 1.4.5 Images of textText is text. | AA | Supports | Every label is live text; the PDF carries its text as text. |
| 1.4.10 ReflowNo two-dimensional scrolling at 320 px. | AA | Supports | The visual fills the room Power BI gives it, down to 64 px, and scrolls in one direction only, along categories that do not fit. How a report page reflows (fit to page, the mobile layout) is Power BI's. |
| 1.4.11 Non-text contrastGraphical objects at 3:1. | AA | Supports | Series inks are solved to stand 3:1 against the report theme's background, the report's colours, a series' own colour and Hue Charts' alike; a colour that would sink is moved, its hue held, and the move said in the warning icon. On the library's own grounds the lowest series is 3.03:1. In high contrast the chart takes Power BI's high-contrast colours. The visual's buttons are drawn in the system's colours, their borders ButtonBorder on Canvas. An observed lightness is never moved; marks below 3:1 are said in the warning icon, their values labelled or in "Show as a table". |
| 1.4.13 Content on hover or focusDismissible, hoverable, persistent. | AA | Supports | Tooltips are Power BI's own service. The PDF and CSV buttons the pointer's hover shows stay while the pointer is over the visual, can be pointed at, and Escape puts them away until the pointer leaves. Measured by the visual's harness in Chrome (platforms/powerbi, npm run test:harness). |
| 2.1.1 KeyboardEverything by keyboard. | A | Supports | The arrow keys walk the data, Home and End jump, Enter or Space selects, Ctrl or Shift adds to the selection, Escape clears it, the Menu key or Shift+F10 opens Power BI's context menu over the datum; the scroll bar along categories that do not fit takes the arrow keys; every button is a button. Power BI's own keys move into and out of a visual. Measured by the visual's harness in Chrome (platforms/powerbi, npm run test:harness): every control within Tab's reach. |
| 2.1.2 No keyboard trapFocus can leave. | A | Supports | Tab leaves the visual as it leaves any of Power BI's; nothing in it opens over the chart or holds the focus. |
| 2.1.4 Character key shortcutsSingle-key shortcuts can be turned off or act only on focus. | A | Supports | Keys act only while the visual has focus. |
| 2.2.1 Timing adjustableTime limits can be turned off or extended. | A | Not applicable | Nothing has a time limit. |
| 2.2.2 Pause, stop, hideMoving content can be paused. | A | Supports | Grow moves only toward the finished chart and settles; a reader who asks for reduced motion gets each finished picture with no movement. |
| 2.4.1 Bypass blocksRepeated blocks can be skipped. | A | Not applicable | A criterion of the report page, which Power BI draws and Microsoft reports on in its own conformance report; the visual sets nothing of it. |
| 2.4.2 Page titledPages have titles that describe them. | A | Not applicable | A criterion of the report page, which Power BI draws and Microsoft reports on in its own conformance report; the visual sets nothing of it. |
| 2.4.3 Focus orderFocus order preserves meaning. | A | Supports | The chart, then its controls in the order they are seen, top to bottom and left to right: the files, PDF and CSV, then the scroll bar. Measured by the visual's harness in Chrome (platforms/powerbi, npm run test:harness). |
| 2.4.4 Link purpose (in context)A link says where it goes. | A | Not applicable | The visual has no link: nothing in it leaves the report. |
| 2.4.5 Multiple waysMore than one way to find a page. | AA | Not applicable | A criterion of the report page, which Power BI draws and Microsoft reports on in its own conformance report; the visual sets nothing of it. |
| 2.4.6 Headings and labelsHeadings and labels describe their topic or purpose. | AA | Supports | The visual's title is Power BI's header; inside, every control is named for what it does. Measured by the visual's harness in Chrome (platforms/powerbi, npm run test:harness). |
| 2.4.7 Focus visibleThe focus is visible. | AA | Supports | The visual and its scroll bar show an outline in the system's Highlight; the datum the keyboard stands on is ringed; buttons show the browser's focus ring. |
| 2.4.11 Focus not obscuredFocus is not hidden. | AA | Supports | No control of the visual stands over another, and nothing opens over the chart. Measured by the visual's harness in Chrome (platforms/powerbi, npm run test:harness). |
| 2.5.1 Pointer gesturesNo path-based or multipoint gesture is the only way. | A | Supports | A click, a right click, and the scroll bar; nothing takes two fingers or a path. |
| 2.5.2 Pointer cancellationNothing completes on the down-event. | A | Supports | A click selects when the button is let go; buttons act on release; the context menu opens when the system raises it. |
| 2.5.3 Label in nameA control's visible words are in its name. | A | Supports | Every button is named by its own words (PDF, CSV). Measured by the visual's harness in Chrome (platforms/powerbi, npm run test:harness). |
| 2.5.4 Motion actuationNothing works by moving the device. | A | Not applicable | Nothing reads the device's motion. |
| 2.5.7 Dragging movementsDragging has an alternative. | AA | Supports | The scroll bar's thumb drags; a click on its track and its arrow keys move it too. |
| 2.5.8 Target size (minimum)Targets at least 24 by 24 px, or an equivalent that is. | AA | Supports | Measured by the visual's harness in Chrome (platforms/powerbi, npm run test:harness): every button and field 24 px each way or more. The scroll bar is the browser's own, its height the browser's (the criterion's user-agent exception). A datum's mark is drawn where its value puts it, which the criterion's essential exception covers, as it does a pin on a map; the keyboard reaches every one. |
| 3.1.1 Language of pageThe page's language is set. | A | Not applicable | A criterion of the report page, which Power BI draws and Microsoft reports on in its own conformance report; the visual sets nothing of it. |
| 3.1.2 Language of partsA passage in another language is identified. | AA | Supports | The visual's own words follow Power BI's locale through its string resources; a chart's words are the report's data. |
| 3.2.1 On focus / 3.2.2 On inputNo change of context. | A | Supports | Focus and input change the chart, never the page. A selection filters the report's other visuals as Power BI's own do, which the report's author sets. |
| 3.2.3 Consistent navigationNavigation is in the same order on every page. | AA | Not applicable | A criterion of the report page, which Power BI draws and Microsoft reports on in its own conformance report; the visual sets nothing of it. |
| 3.2.4 Consistent identificationThe same function is named the same way. | AA | Supports | Every chart's controls are the same controls with the same names. |
| 3.2.6 Consistent helpHelp, where offered, is in the same place. | A | Not applicable | The visual offers no help mechanism. |
| 3.3.1 Error identificationErrors are described in text. | A | Supports | Rows the visual cannot draw are counted and named in Power BI's warning icon; a chart missing a field says which fields it needs; what the ask cannot take from words is said beneath it. |
| 3.3.2 Labels or instructionsInputs have labels or instructions. | A | Supports | The visual draws no field of its own. The Format pane's labels are Power BI's; Ask for a chart there shows an example of what to ask. |
| 3.3.3 Error suggestionA known fix is suggested. | AA | Supports | A chart missing a field names the fields to add; too many groups says to filter the report; words no chart fits are said in the warning icon, with what to name instead. |
| 3.3.4 Error prevention (legal, financial, data)Commitments can be checked or undone. | AA | Not applicable | The visual commits nothing and sells nothing. |
| 3.3.7 Redundant entryNothing is asked for twice. | A | Supports | The ask writes what it took into the report's own formatting, where the Format pane shows it, and empties its box. |
| 3.3.8 Accessible authentication (minimum)No cognitive test to sign in. | AA | Not applicable | Nothing signs in, and nothing is entered from memory. |
| 4.1.2 Name, role, valueControls expose name, role and state. | A | Supports | The visual is a figure named with its chart and state, in Tab's reach; its buttons are buttons; its scroll bar is named for what it moves. |
| 4.1.3 Status messagesStatus is announced. | AA | Supports | The datum the keyboard stands on is announced through a polite live region. |
Label contrast
Label contrast, computed
| Ground | Title | Context | Figure | Figure, narrow | Label | Value | Chip | Note | Clock figures, small | Clock figures | Clock figures, large |
|---|---|---|---|---|---|---|---|---|---|---|---|
| dark | 15.45:1 | 7.33:1 | 15.45:1 | 15.45:1 | 7.33:1 | 15.45:1 | 15.45:1 | 7.33:1 | 15.45:1 | 15.45:1 | 15.45:1 |
| light | 18.10:1 | 5.86:1 | 18.10:1 | 18.10:1 | 5.86:1 | 18.10:1 | 18.10:1 | 5.86:1 | 18.10:1 | 18.10:1 | 18.10:1 |
Series inks
Series inks, as every chart draws them
| Ground | Series | Lowest contrast | Normal | Protan | Deutan | Tritan | All pass |
|---|---|---|---|---|---|---|---|
| dark | 2 | 6.94:1 | 0.261 | 0.206 | 0.171 | 0.126 | yes |
| dark | 3 | 5.62:1 | 0.117 | 0.100 | 0.111 | 0.128 | yes |
| dark | 4 | 4.96:1 | 0.167 | 0.113 | 0.062 | 0.096 | yes |
| dark | 5 | 3.90:1 | 0.144 | 0.118 | 0.124 | 0.145 | yes |
| dark | 6 | 3.47:1 | 0.137 | 0.101 | 0.106 | 0.112 | yes |
| dark | 8 | 3.54:1 | 0.137 | 0.087 | 0.072 | 0.093 | yes |
| light | 2 | 4.41:1 | 0.316 | 0.263 | 0.236 | 0.115 | yes |
| light | 3 | 3.81:1 | 0.221 | 0.066 | 0.157 | 0.169 | yes |
| light | 4 | 3.03:1 | 0.215 | 0.140 | 0.071 | 0.097 | yes |
| light | 5 | 3.44:1 | 0.140 | 0.108 | 0.066 | 0.082 | yes |
| light | 6 | 4.42:1 | 0.107 | 0.100 | 0.102 | 0.100 | yes |
| light | 8 | 3.42:1 | 0.097 | 0.071 | 0.065 | 0.063 | yes |
Every row passes. The solver keeps the theme's own lightness and colour when they already pass, and otherwise widens to a darker or lighter ink and fuller colour.
Scope and method
What it covers, and how it was checked
<hue-chart> element meets the same rows as the web element except 2.5.8, where its legend entries are its series switches, and the high-contrast switch in 1.4.11.- The web element and Chart Studio: checked by the library's tests (the regions and their order, contrast and colour-vision figures) and by keyboard in Chrome on Windows. Forced colours, 200% zoom and screen readers are supported in the code; testing them by hand with users, in an independent audit, is still to do. Exports: SVGs carry a title and description, PDFs carry their text as text; a PNG is an image and is described by the chart that made it. The figures on this page are computed by
contrastRatioandcomply, the same functions every chart is drawn through. - The Power BI visual: covers it as packaged, in reading and edit views — the chart, its words, the keyboard's walk, its buttons (PDF and CSV) and the scroll bar along categories that do not fit. Measured by the visual's harness, the packaged visual in Chrome under a stand-in host: every control named, its words in its name, 24 px each way, none over another, met by Tab top to bottom; the keyboard's walk, its ring and what it says; Escape putting away the hover's buttons; high contrast. Power BI's own frame (its keys into a visual, its tooltips, “Show as a table”, the alt text) stays a test by hand in Power BI Desktop. Screen readers are supported in the code and not yet tried by hand in Power BI; that, with users, is the independent audit's first task. Covers visual version
1.1.0.389, the library's own reading, read from the packagedhue-charts.pbivizitself (commit 8ddf6a6+, built 2026-11-03). Power BI harness: 130 of 130 checks pass, the library's own reading, commit 0175031d6, read 2026-10-23.