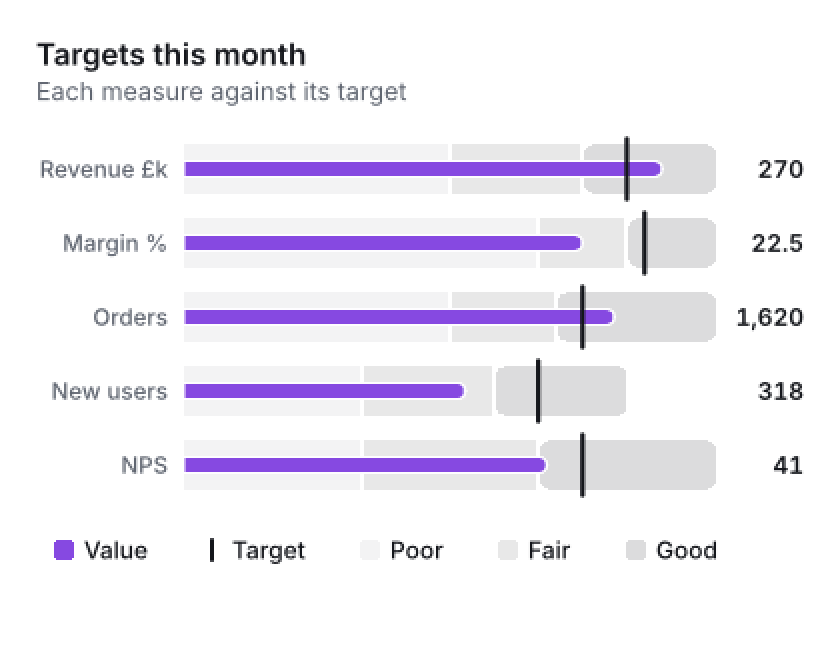
Why teams choose Hue Charts.
The decision
The short answer, before the evidence.
Where it wins
The same chart everywhere, nothing else to install, and built for accessibility law: read beside ten other libraries.
What it costs
Free to use; a whole organisation's plan is £1,000 a year or £100 a month, with no seats.
Who it is for
Reports someone must stand behind, products under accessibility law, and teams that review every dependency.
Side by side
Eleven chart libraries, the same questions.
| Library | To start | Ten developers, year one | Free to use |
|---|---|---|---|
| Hue Chartshue-charts 1.0.0 | Free, every everyday chart | £1,000, a Business plan for the whole organisation | Every everyday chart, for any use, with its credit |
| Highchartshighcharts 13.1.1 | $366 a developer a year | Quoted; $3,660 by seat, Core alone | Personal and education only |
| amCharts 5@amcharts/amcharts5 5.21.3 | Free with its logo; $80 a seat a year | $2,800 by its $280 SaaS seat | Every feature, its logo shown |
| Apache EChartsecharts 6.1.0 | Free · Apache 2.0 | $0 | Everything, commercial use |
| Chart.jschart.js 4.5.1 | Free · MIT | $0 | Everything, commercial use |
| Plotly.jsplotly.js 4.1.2 | Free · MIT | $0 | Everything, commercial use |
| D3.jsd3 7.9.0 | Free · ISC | $0 | Everything, commercial use |
| AG Chartsag-charts-community 14.2.0 | Community free · Enterprise $499 a developer | $4,990 by seat | Community, in production |
| SciChart.jsscichart 6.0.13 | $1,349.66 a developer, a year's term | $13,497 by seat | Non-commercial, watermarked |
| LightningChart JS@lightningchart/lcjs 9.0.0 | From $2,750 a developer | Quoted; $27,500 by seat | Non-commercial; a 30-day trial |
| Vega-Litevega-lite 6.5.0 | Free · BSD-3 | $0 | Everything, commercial use |
| Library | Paid support | A written response time |
|---|---|---|
| Hue Charts | With a Business or Enterprise plan | 4 business hours on Enterprise for a critical fault, fixed in 7 days |
| Highcharts | Included | 36 hours, Norwegian working days |
| amCharts 5 | $190 a seat a year | None: an internal 24-hour goal |
| Apache ECharts | None from the project | None stated |
| Chart.js | None: community kept | None |
| Plotly.js | None for plotly.js | None for plotly.js |
| D3.js | None stated | None stated |
| AG Charts | Enterprise, by ticket | The next business day, best efforts |
| SciChart.js | Within a one- to three-year term | An aim of one business day |
| LightningChart JS | Four tickets a year | None stated |
| Vega-Lite | None: community kept | None |
| Library | On a server, no browser | Power BI | AI assistants (MCP) | |
|---|---|---|---|---|
| Hue Charts | PNG, SVG and PDF, the same bytes | Its own visual, 29 charts; not yet in AppSource | Tagged to PDF/UA-1; PDF/X-4 for print | Its own, in the package, offline |
| Highcharts | An export server on a headless browser | None in AppSource | By add-ons; tagging not stated | Official, hosted |
| amCharts 5 | Not stated; its guide drives a browser | None in AppSource | The chart as a picture in a PDF | Official, hosted |
| Apache ECharts | SVG with no dependencies; PNG by node-canvas | A third party's, uncertified | No PDF; PNG, JPEG or SVG | A reference example |
| Chart.js | Through node-canvas | None in AppSource | No PDF; PNG or JPEG | Community servers only |
| Plotly.js | Needs Chrome (Kaleido) | A third party's, certified | No PDF; PNG, JPEG, WebP or SVG | For Dash, not plotly.js |
| D3.js | Path strings, no picture | A third party's, uncertified | No export | Community servers only |
| AG Charts | Enterprise only: PNG, JPEG | None in AppSource | No PDF; PNG or JPEG | Official, written for AG Grid |
| SciChart.js | Not stated | None in AppSource | Not stated | In testing, for customers |
| LightningChart JS | Through lcjs-headless (MIT; it needs an lcjs licence) | None in AppSource | No PDF; pictures into PDFKit | Official |
| Vega-Lite | SVG; PNG and PDF by node-canvas | Deneb, a third party's, certified | By its command line; tagging not stated | None official |
| Library | The same picture everywhere | Accessibility | Dependencies and SBOM | Security policy |
|---|---|---|---|---|
| Hue Charts | Byte for byte, with a digest | WCAG 2.2 AA report; keyboard, screen reader | None; CycloneDX and SPDX SBOMs | A SECURITY.md in the package, and a written clock |
| Highcharts | Not stated | ACR, WCAG 2.1 AA; keyboard, screen reader | None; no SBOM stated | SECURITY.md |
| amCharts 5 | Not stated | ACR, WCAG 2.0 AA; keyboard, screen reader | 25; no SBOM | SECURITY.md |
| Apache ECharts | Not stated | Opt-in ARIA; no keyboard; no report | 2; no SBOM | Apache's security page |
| Chart.js | Not stated | No report; ARIA left to you | 1; no SBOM | None found |
| Plotly.js | Not stated | No report found | 42; no SBOM | SECURITY.md |
| D3.js | Not stated | No module; no report | 30 of its own modules; no SBOM | None found |
| AG Charts | Not stated | Keyboard, screen reader; no report | 3, Enterprise 2; a CycloneDX SBOM | SECURITY.md |
| SciChart.js | Not stated | Built by you through its APIs; no report | None; no SBOM stated | None published |
| LightningChart JS | Not stated | No report found | 3; no SBOM | None found |
| Vega-Lite | Not stated | ARIA on SVG; no keyboard, no report | 6, and Vega's own 27; no SBOM | SECURITY.md |
| Library | On the GPU | The most it claims |
|---|---|---|
| Hue Charts | Fast mode on the GPU, and exact mode | Four billion samples by range, zoomed at 139 frames a second |
| Highcharts | WebGL, its Boost module | A million scatter points |
| amCharts 5 | Canvas; WebGL for map rasters only | Not stated |
| Apache ECharts | Through ECharts GL | Millions of points |
| Chart.js | No: Canvas 2D | Not stated |
| Plotly.js | WebGL traces | A million points |
| D3.js | SVG or Canvas, as you build it | Not stated |
| AG Charts | Not stated | Over a million points |
| SciChart.js | WebGL, WebAssembly, WebGPU | 100 million points at 60 frames a second |
| LightningChart JS | WebGL | 4,000 million line points |
| Vega-Lite | No: Canvas or SVG | Not stated |
Every answer from each vendor's own pages, read at its latest release on 17 October 2026, and LightningChart JS's most on 23 October; dependencies from npm, Power BI visuals from Microsoft's AppSource. A price “by seat” is ten times the vendor's own seat price. A full mark is what it offers, a lighter one a part of it or an add-on, an empty one none; “not stated” means its pages say nothing, which is not proof it is missing.
Heavy data
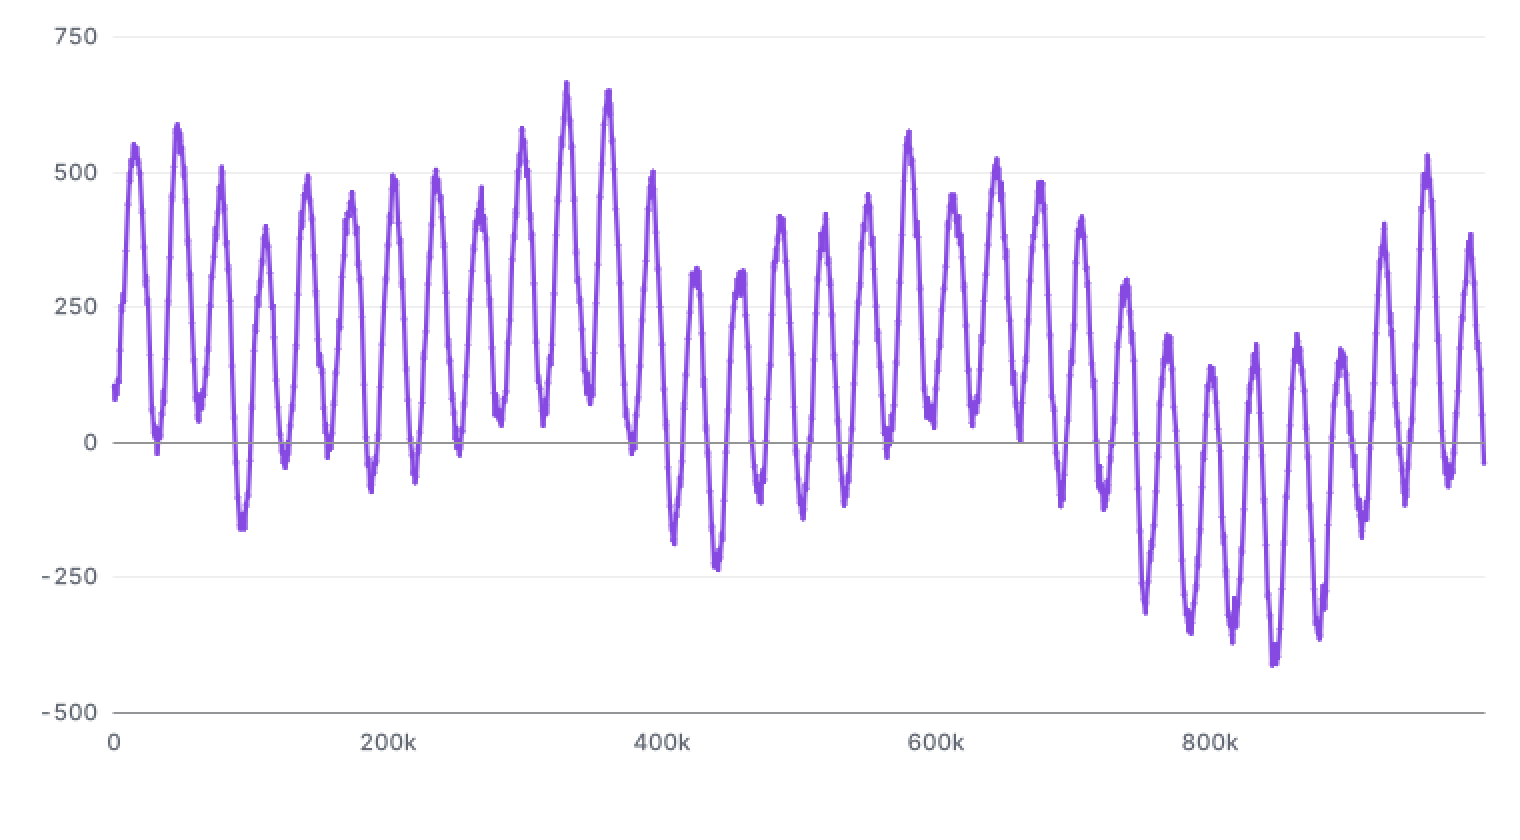
A billion samples, every peak kept.
17 ms
to draw a million-point line first, then about 6 ms a frame as you zoom
136 ms
to draw a million-point scatter first, every point counted once, then about 15 ms a frame
114 ms
to draw ten million points as a line first; about 3.1 s as a scatter
16 MB
for a live stream's million-point window, fixed, tested over ten million values
Billions of samples
A billion samples zoom at 147 frames a second, and four billion at 139, on a screen at 154 Hz.
Opens on its data
A million-point line draws first in 17 ms on the CPU, so a dashboard opens on its data.
Zooms on the GPU
A million points zoom at 124 frames a second on the GPU, and ten million at 140, on a desktop at 154 Hz.
Streams in fixed memory
Live feeds append for as long as they run, and the window's memory holds steady.
The same on the server
The same speed in node for reports and email, with the same digest as the browser.
760 × 420 on the CPU in Node 24.8, on an Intel Core i7-14700K desktop at normal priority, as a server runs, 28 October 2026: a first draw of new data, and a frame over the same data after it. The stream's window is fixed by its construction.
Fast mode on the GPU, a million and ten million points held and zoomed for three seconds in Edge 156 on an Intel Core i7-14700K with an RTX 4060 Ti, on a screen read at 154 Hz, 28 October 2026.
Fast mode, a billion and four billion samples by range, their extremes built first in 3.8 s and 32.3 s, each zoomed from the whole to a thousandth and back for three seconds in Edge 156, Intel Core i7-14700K and RTX 4060 Ti, on a screen read at 154 Hz, 28 October 2026.
One spike in a billion samples by range, its extremes built first in 2.96 s, traced at twelve zooms to 238 samples in Node 24.8, Intel Core i7-14700K, 28 October 2026.
Assistants and MCP
Where the picture is made
Over the Model Context Protocol, Hue Charts draws the chart on your own machine: no account to run it, no cloud call, no cost per chart. Its pictures carry the Hue Charts credit, which a Business or Enterprise plan switches off.
Renders on your machine
Hue Charts: the only vendor's own server found that draws its pictures with no network call.
Renders in a cloud
One of Highcharts' three servers, a picture back from the vendor's service; Apache ECharts' reference example, its pictures kept in the user's own cloud storage.
Works what is already built
Tableau's server works a dashboard, Power BI's a semantic model, and Dash's a running app's layout and callbacks.
Documentation and code
Highcharts' other two (documentation, validation and production-ready code), and AG Charts', amCharts 5's, SciChart.js' and LightningChart JS': references and code, never a picture.
No official server
Chart.js, D3, TradingView Lightweight, deck.gl and three.js. Of the community servers, Chart.js' renders on your machine; the D3 and TradingView ones write code.
Questions buyers ask
Questions buyers ask
| Question | Answer |
|---|---|
| A young product | Everything is tested and documented from the source, and the tests run anywhere without a single dependency; nothing is hidden behind a binary or a service. |
| Incumbents' ecosystems | The spec is plain JSON a person or a model can write; the output is standard PNG, SVG and PDF that every tool opens. |
| Performance claims against GPU libraries | Each figure is measured, with its machine and date under Heavy data. Exact mode draws on the CPU, the same picture on every engine the SLA covers. Fast mode draws on the GPU as a game does, faster on most charts and without a digest. |
| Accessibility parity with Highcharts | Keyboard, announcements, data tables, solved palettes, full-size series switches and a published WCAG 2.2 AA report. An independent audit with screen-reader users is still to do. |
For your business case
The detail, when you write it up.
What businesses draw, sector by sector
| Sector | Charts | The guarantee that matters |
|---|---|---|
| Finance | Candlestick with moving average and Bollinger bands, waterfall bridges, live feeds | the digest for regulated reporting; deterministic PDFs for board packs |
| Healthcare | ECGs, EEGs and Holters and hypnograms, with Business and Enterprise; box plots and error bars | accessibility law; the same output for the same record, with its digest |
| Energy and climate | Streamgraphs of the generation mix, weather boards | long series at full resolution; SVG for publication |
| Logistics | Flow maps on great circles, Gantt | maps without a map vendor; charts that answer a click |
| SaaS and web analytics | Funnels, cohort heatmaps, area, donut, world map | the Chart Studio and the JSON spec in the product itself |
| Public sector | Choropleths, population pyramids, bullets against targets | accessibility law, air-gapped deployment, no runtime dependencies |
| Science and manufacturing | Strip charts, persistence and eye diagrams, order tracking and Campbell diagrams, chromatograms, mass spectra and stacked NMR, IR, Raman and UV-Vis spectra, spectrograms and spectrum waterfalls, Bode plots, Smith charts and antenna polar plots, with Business and Enterprise; histograms and scatter at millions of points | exactness at scale; the same figure on every machine |
| Geoscience | Cross-plots of a well's logs among the lithology lines, with Business and Enterprise | every sample of the log kept; the same figure on every machine, with its digest |
What each person who signs off gets
| Who | Their problem | What Hue Charts gives them |
|---|---|---|
| Security and platform | Every npm dependency is an attack surface; the 2025 compromises (chalk, debug, Shai-Hulud) reached billions of weekly downloads. | One package to audit: zero runtime dependencies, no install scripts, an SBOM in CycloneDX and SPDX of every shipped file and of what it carries from others, each with its licence, no eval, no CDN, runs under a strict CSP and air-gapped. |
| Compliance and audit | Reports must be reproducible; the EU Cyber Resilience Act has required vulnerability reporting since 11 September 2026, and requires SBOMs from December 2027. | A chart is the same bytes on every machine, with an eight-digit digest to file beside the report. Rerun it next year and the digest must match. |
| Accessibility | The European Accessibility Act has applied since June 2025; US ADA Title II deadlines follow in 2027 and 2028. | Keyboard navigation through the data, screen-reader announcements, a data table for every chart, palettes solved for colour-vision deficiency, high contrast and forced colours honoured, SVGs and PDFs that carry their data as text. |
| Engineering | Chart libraries that differ in look, API and data shape. | One catalogue of 61 charts and one declared spec that people, servers and language models write the same way. The PNG, SVG, PDF and movement all come from one drawing. |
| Data and analytics | Big series slow browsers down or get sampled until they lie. | Every peak of a billion samples kept, each pixel column holding its full range, and a million points drawn in tens of milliseconds. |
| Finance and procurement | Per-seat licences, OEM tiers, domain locks and five-figure embedded BI. | Free to use; one published price for a whole organisation, with no seats, no licence keys, no phone-home and no domain lock. |
How to adopt it, and the decision
How to adopt it
- A pilot of one week.Pick three charts your product already has. Render them server-side in node, export PDF and SVG, file the digests, and run the accessibility check on your brand palette.
- Integrate.Hand the chart spec from your backend or your model; the Chart Studio on this site writes the same spec. Put the data table and keyboard navigation in front of your accessibility team.
- Scale.Move big series to the reductions that keep every peak, reports to the PDF writer, and audits to the digests.
The decision
Hue Charts is for reports someone must stand behind, products under accessibility law, and teams that review every dependency. It brings no dependencies, the same picture everywhere, charts everyone can read, and movement with a digest in every frame. It draws a million points without a GPU, keeps every peak of a billion, and holds 61 charts in one spec. Start with the one-week pilot.
Sources
Where every figure comes from.
- Market size estimates
- npm downloads, State of JS Charting 2026
- Highcharts pricing
- Highcharts accessibility
- ECharts 6 release notes
- AG Charts pricing
- SciChart pricing
- LightningChart JS pricing
- three.js in 2026
- TradingView Lightweight Charts
- Tableau embedded pricing
- European Accessibility Act
- npm supply-chain compromise, CISA
- EU Cyber Resilience Act and SBOMs
- WebGPU in every major browser
- Canvas output differs by GPU and driver
- Highcharts MCP servers
- Apache ECharts MCP server
- Chart.js MCP server (community)
- D3 MCP server (community)
- Dash MCP
- Plotly Cloud MCP
- AG Charts MCP server
- amCharts 5 MCP server
- SciChart MCP
- LightningChart JS MCP server
- TradingView Lightweight Charts MCP server (community)
- Tableau MCP
- Power BI Authoring MCP
- Highcharts licence agreement: support and response
- Highcharts licence terms: free use
- Highcharts accessibility conformance report
- Highcharts export server
- Highcharts PDF export
- Highcharts Boost module
- Highcharts security policy
- amCharts store
- amCharts support
- amCharts accessibility conformance
- amCharts PDF export
- amCharts AI and MCP
- ECharts server-side rendering
- ECharts accessibility
- ECharts security
- Chart.js in Node.js
- Chart.js accessibility
- Plotly.js static image export
- Kaleido, Plotly's image export
- Plotly.js WebGL
- AG Charts prices, per developer
- AG Charts Enterprise licence: support
- AG Charts server-side rendering
- AG Charts accessibility
- AG Charts release and SBOM
- SciChart support
- SciChart security and quality
- SciChart.js features
- LightningChart JS headless
- LightningChart JS performance, its own figures
- LightningChart JS MCP server, its repository
- Vega usage: server-side and PDF
- Vega-Lite support
- Vega security policy
- npm registry, each package's dependencies
- Microsoft AppSource, Power BI visuals