Hue Draw

Free to use. Pay for the company behind it.

The software is free to use. You pay for the company behind it. One library, every everyday chart in every plan, for any use, and the charts of science with Business and Enterprise; a plan covers a whole organisation, with no seats, and never counts viewers, charts, servers or domains.

The three plans

Free, Business and Enterprise

Every plan has every everyday chart and every feature. A plan covers a whole organisation, with no seats, and buys the company behind it: the paid packages, which draw no credit and draw the charts of science, the Power BI visual, support, the standards and law pack, and a say in what comes next.

Free

Anyone, any use

Free

Every everyday chart, for any use, commercial included
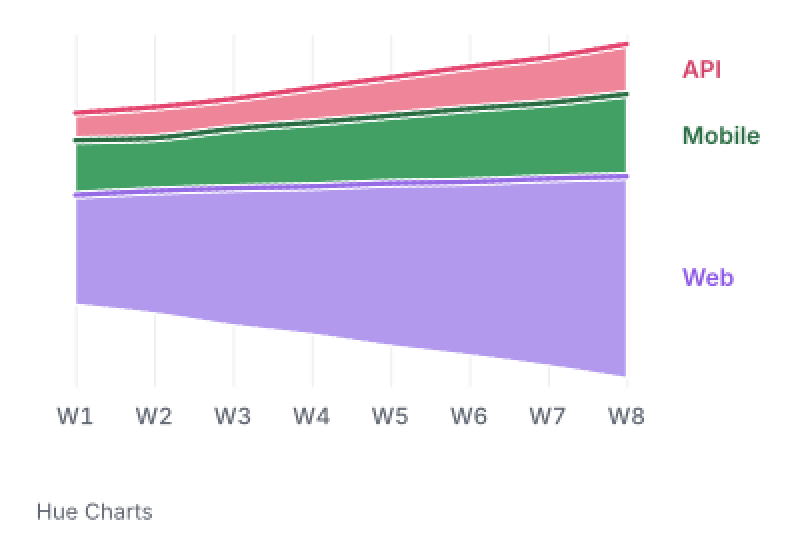
A streamgraph of weekly active users by platform over eight weeks: Web rising from 120 to 221, Mobile from 60 to 90, and API from 30 to 55, with the Hue Charts credit in its corner.
For
Anyone, for any use, commercial included
The credit
The free packages: the Hue Charts credit on every chart
Charts of science
Every chart of science to try in Chart Studio, with its sample
Boards and charts
100 a person, shared by link

Business

Your whole organisation

£1,000

A year for the whole organisation; or £100 a month

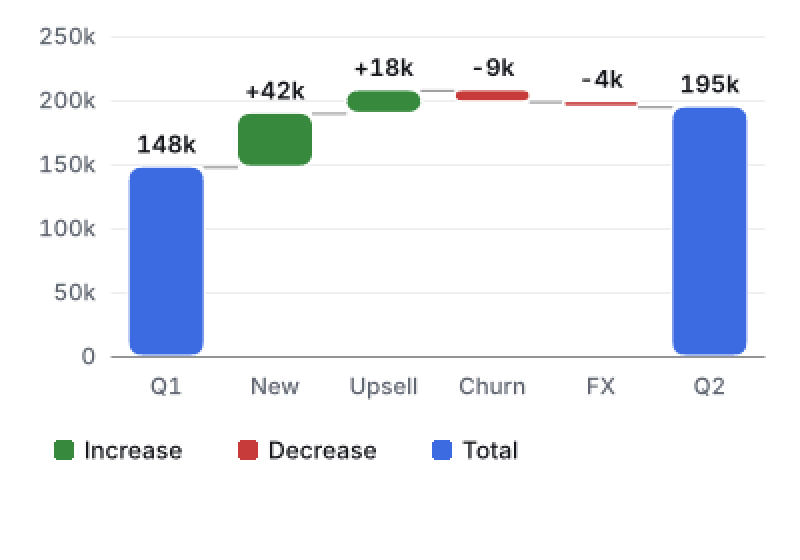
A waterfall chart of a quarter's revenue bridge: $148,000 opening, stepping up $42,000 New and $18,000 Upsell, down $9,000 Churn and $4,000 FX, to $195,000 closing, with no credit.
For
One organisation, every person in it
The credit
None: the paid packages and the Power BI visual
Charts of science
Every chart of science, for example the ECG, EEG and Holter, chromatograms and spectra, Bode, Smith and polar plots and the hypnogram, with their file readers
Support
Email, a reply the next business day
Boards and charts
1,000 a person included

Enterprise

Under the SLA

£5,000

A year for the whole organisation; or £500 a month

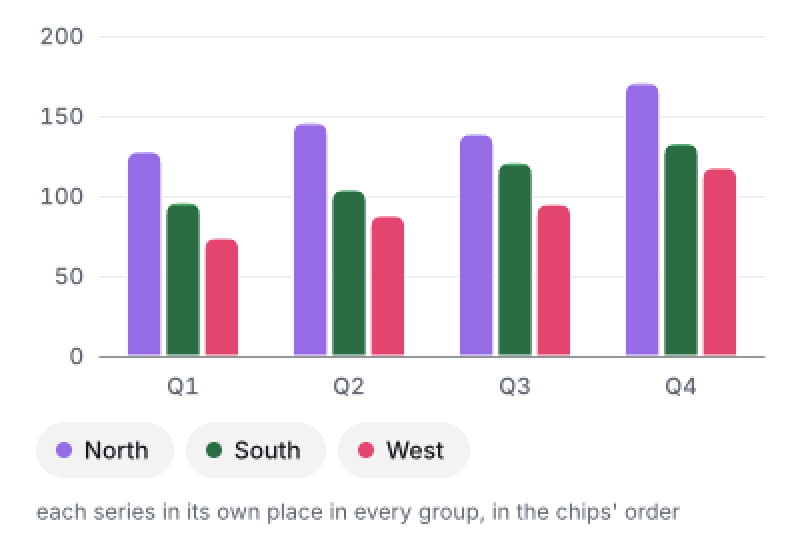
A column chart of three series over four quarters, Q1 to Q4: North from 128 to 171, South from 96 to 133 and West from 74 to 118, each series in its own place in every group.
Everything in Business
And the SLA, signed with your organisation
Support
From the SLA's signing, a Critical issue answered within 4 business hours; a named contact
Expansion
One feature for each three months paid, built to its need and shipped to everyone
Boards and charts
10,000 a person included

What every plan gets

Every everyday chart, in every plan.

  • Every everyday chart, every file

    Every everyday chart and recipe, Chart Studio and the MCP server, PNG, SVG, PDF, print PDF and CSV, and every accessibility feature; every chart of science to try in Chart Studio.

    Open Chart Studio

  • Read before you build

    The chart API, the JSON Schema of every chart and recipe, and how to set it up on each platform, open to everyone.

    Read the chart API

  • Ready for your audit

    A self-assessed WCAG 2.2 AA report, an SBOM of every shipped file, private security reports and five years of fixes on every major.

    Read the law and standards

How the plans work

One price for a whole organisation.

  • No seats

    One price for a whole organisation, whatever its size: everyone in it, and its contractors while they build for it.

  • Free to use

    Build, ship and sell with every everyday chart on Free, at any scale, the Hue Charts credit on its charts; the charts of science come with Business and Enterprise.

  • Offline

    No key, no licence file, no call home, no domain lock: a plan gives the paid packages, which draw no credit, and nothing checks it.

  • Further boards and charts

    Past a plan's number, £0.72 a year or £0.06 a month for each further 1,000 boards and charts a person, or part of them, billed at the renewal: 1,000 boards and charts at their 512 KiB ceiling are 0.524 GB; at the store's $0.125 a GB a month (supabase.com/pricing, read 2026-10-20), $1.32 to the pound and a 20% margin, rounded up to the penny.

  • The roadmap

    Business votes on what is built next. Enterprise asks for one feature for each three months paid, built to its need and shipped to everyone.

    The roadmap

  • Who buys

    Plans are sold to organisations and to people buying for their work, not to consumers.

Ten people, first year, live

What a team spends on charts

  • Tableau embedded$60k
  • LightningChart JS$27.5k
  • SciChart.js$13.5k
  • AG Charts Ent.$5k
  • Highcharts$3.7k
  • Hue Charts£1,000
  • amCharts 5$2.8k
Prices read on 17 October 2026, Tableau's an estimate: the others in US dollars before tax, Hue Charts' bar drawn at about $1.32 to the pound (1 October 2026).
What each row counts

Tableau is a third party's estimate of its embedded floor, as Tableau sells by quote; LightningChart JS is from $2,750 a developer, before its discount from three seats; Highcharts is Core alone, with Stock, Maps and Gantt sold on top; amCharts 5 is its SaaS seat; AG Charts is Enterprise. Hue Charts' row is a Business plan paid yearly — £1,000 for the whole organisation, ten people or a thousand — every feature and support in it.

Compare the field in full